
About Weather data section
There are several ways to get to the section:
-
Go to the left-hand menu and choose the "Weather data" section
-
While you are in the "Satellite data & Statistics" section, click on the "weather" icon in the list of polygons section (see the screen below)
![]()
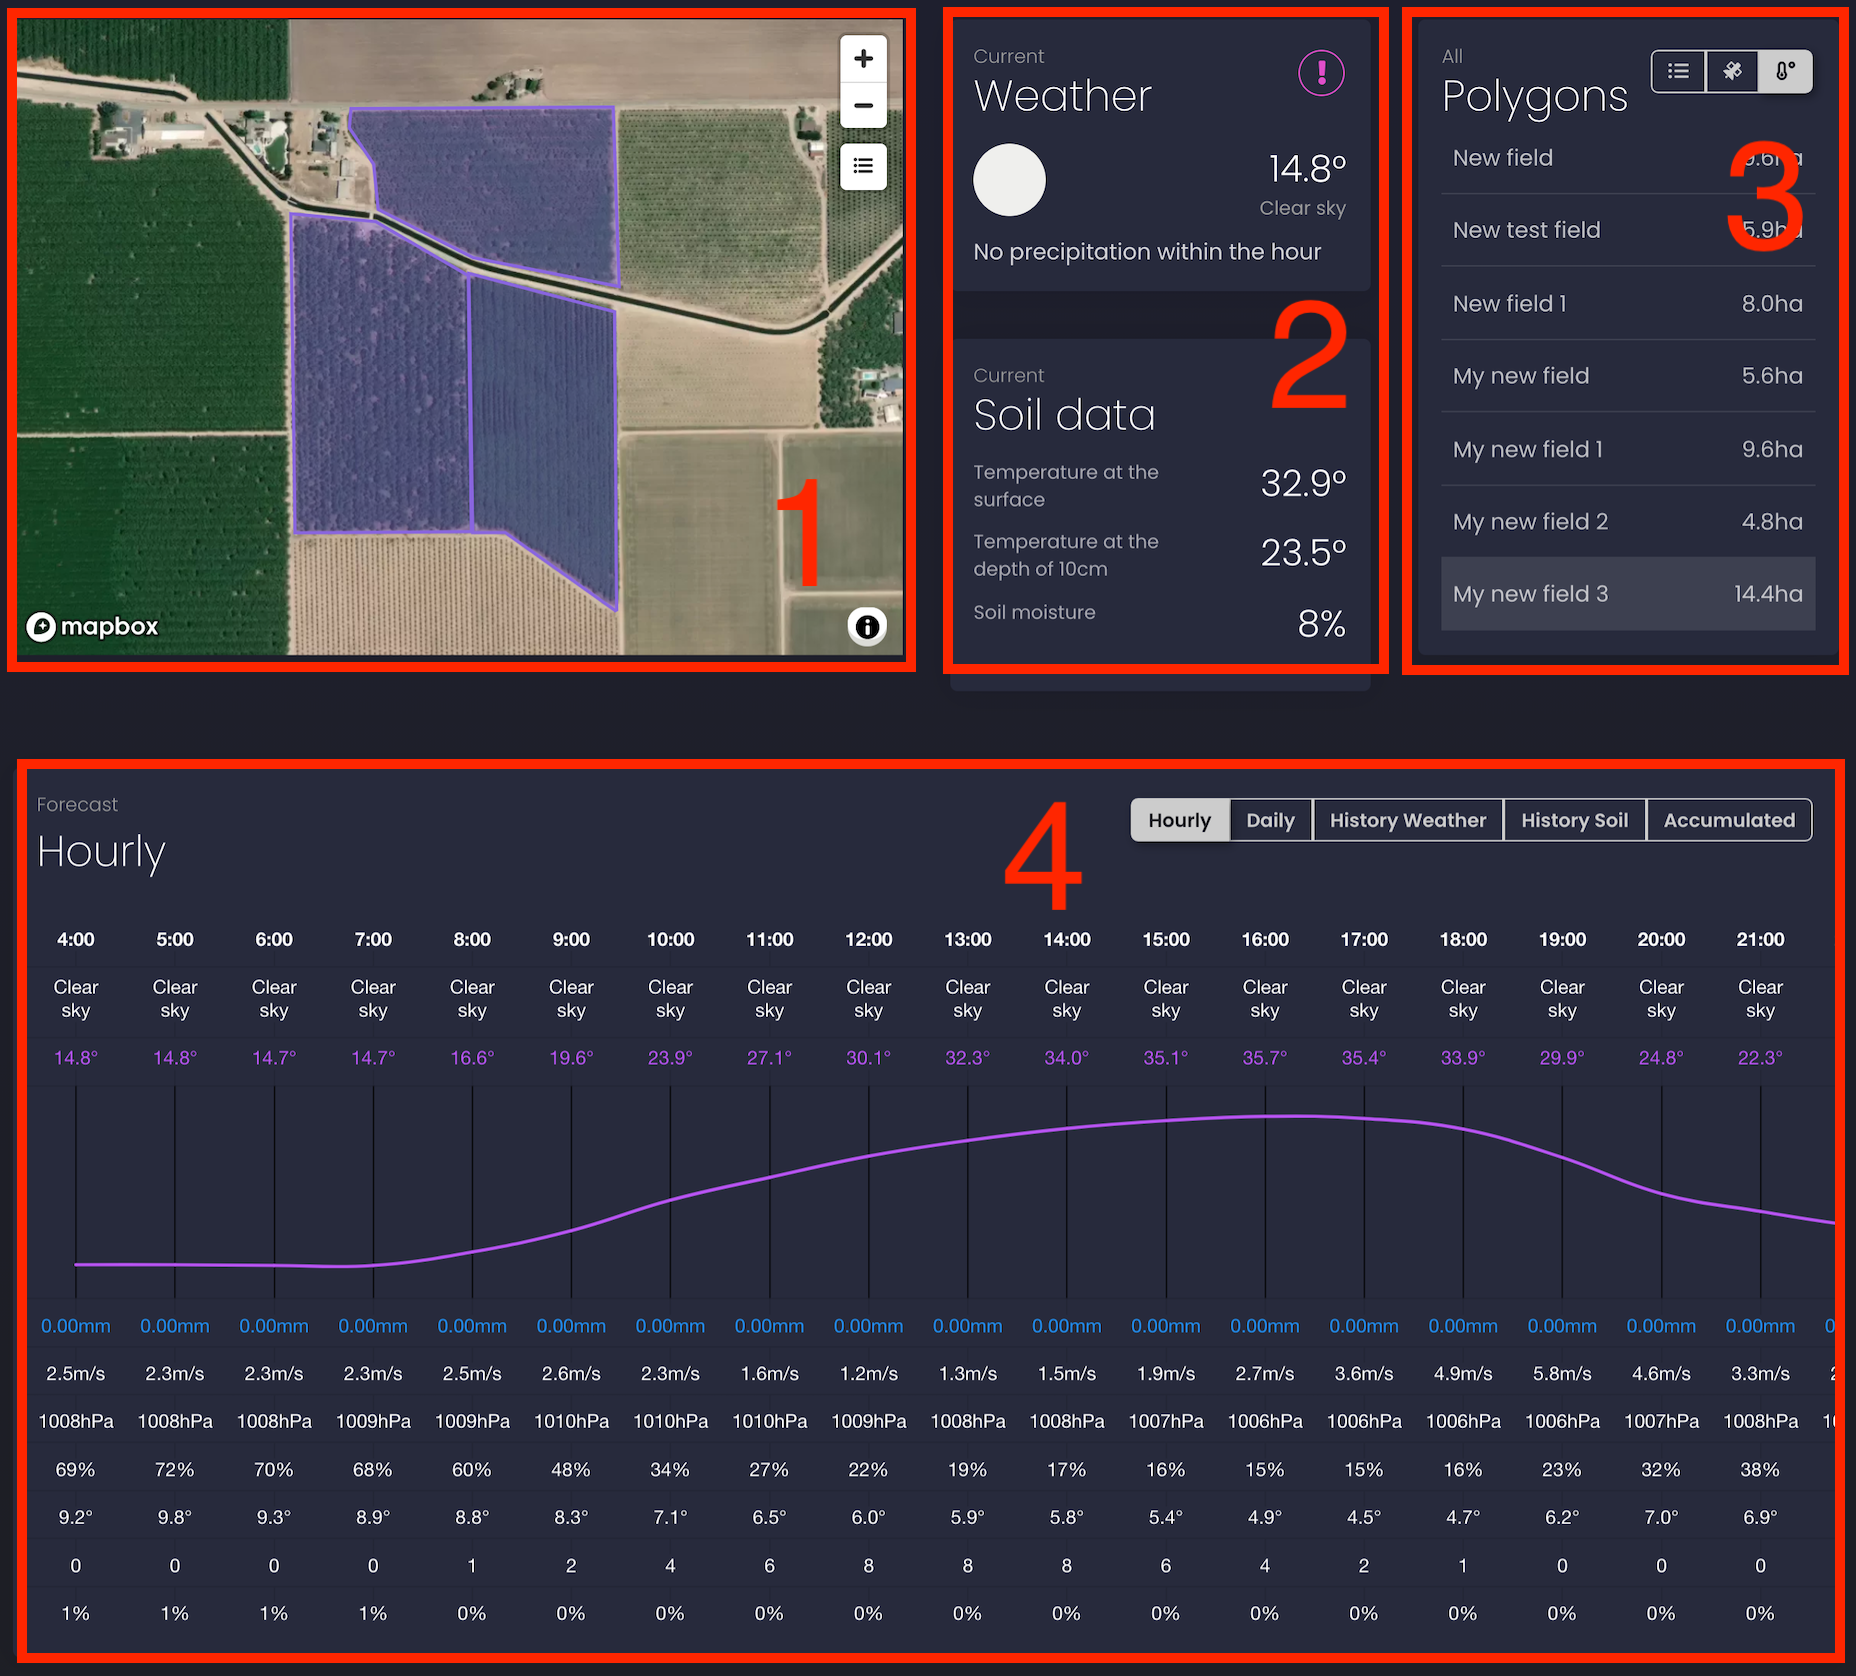
Weather data section contains the following:
-
A map with polygons
-
Current weather data, current soil data
-
A polygons list
-
Weather data:
-
Hourly forecast for 2 days
-
Daily forecast for 8 days
-
Historical weather data chart
-
Historical soil data chart
-
Accumulated temperature and precipitation chart
Current weather and soil data
1. Go to the "Weather data" section. Please read here how to get there.
-
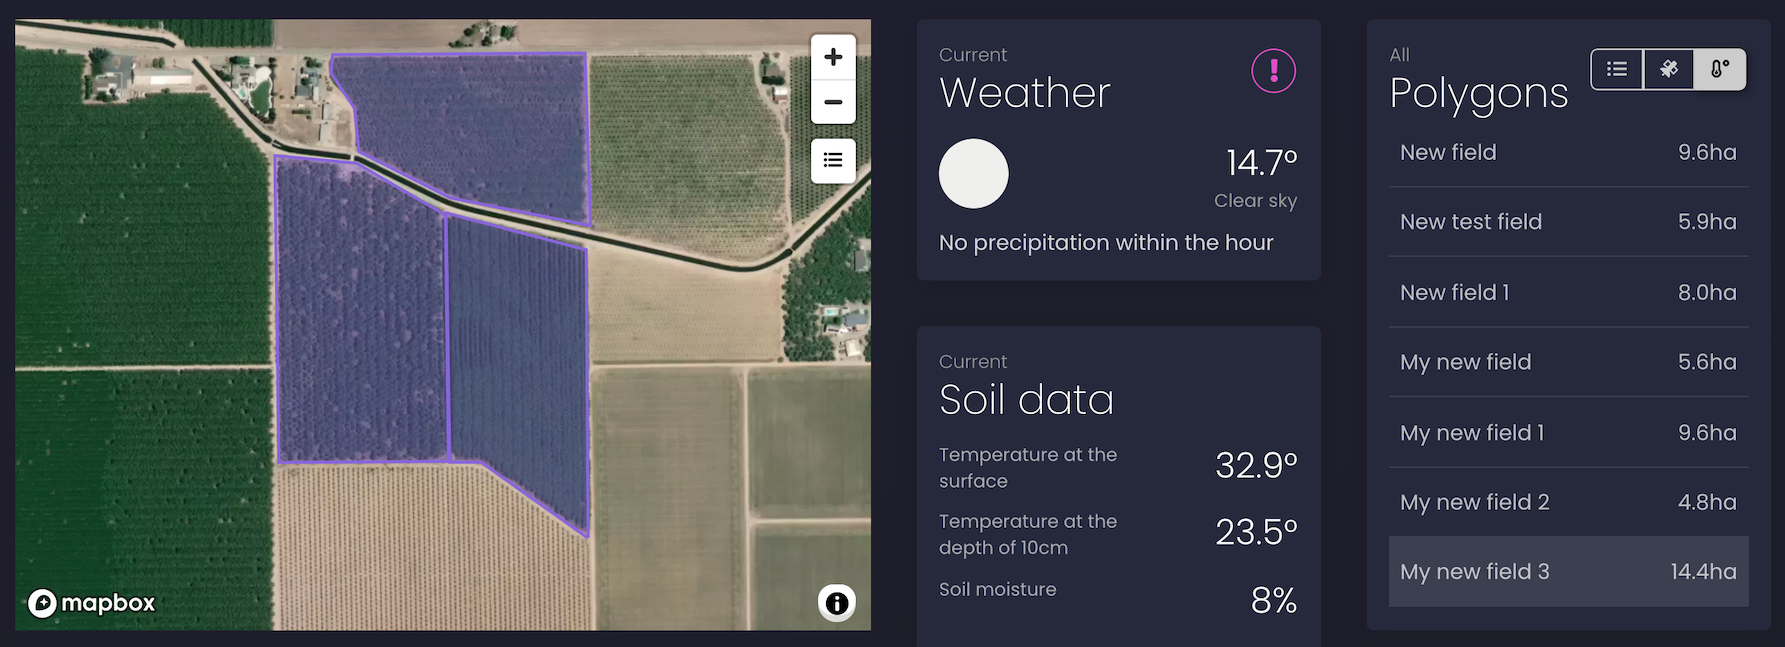
In the current weather and soil data section, you will see data for one of your polygons.
2. You can select a different polygon from the right-hand section of the polygons list.
-
Current weather and soil data for this polygon will be displayed in the corresponding section (see on the screen below).
Legend
Current weather data:
-
Current temperature
-
Current weather conditions
-
Severe weather alerts (icon is displayed only if alerts are available for this territory and if there is an active alert that was issued). Click on the exclamation mark icon to get detailed information about weather alerts.
-
Precipitation forecast for the next hour down to the minute
Current soil data:
-
Temperature at the surface
-
Temperature at the depth of 10cm
-
Soil moisture, m3/m3
Hourly forecast for 2 days
1. Go to the "Weather data" section. Please read here how to get there.
-
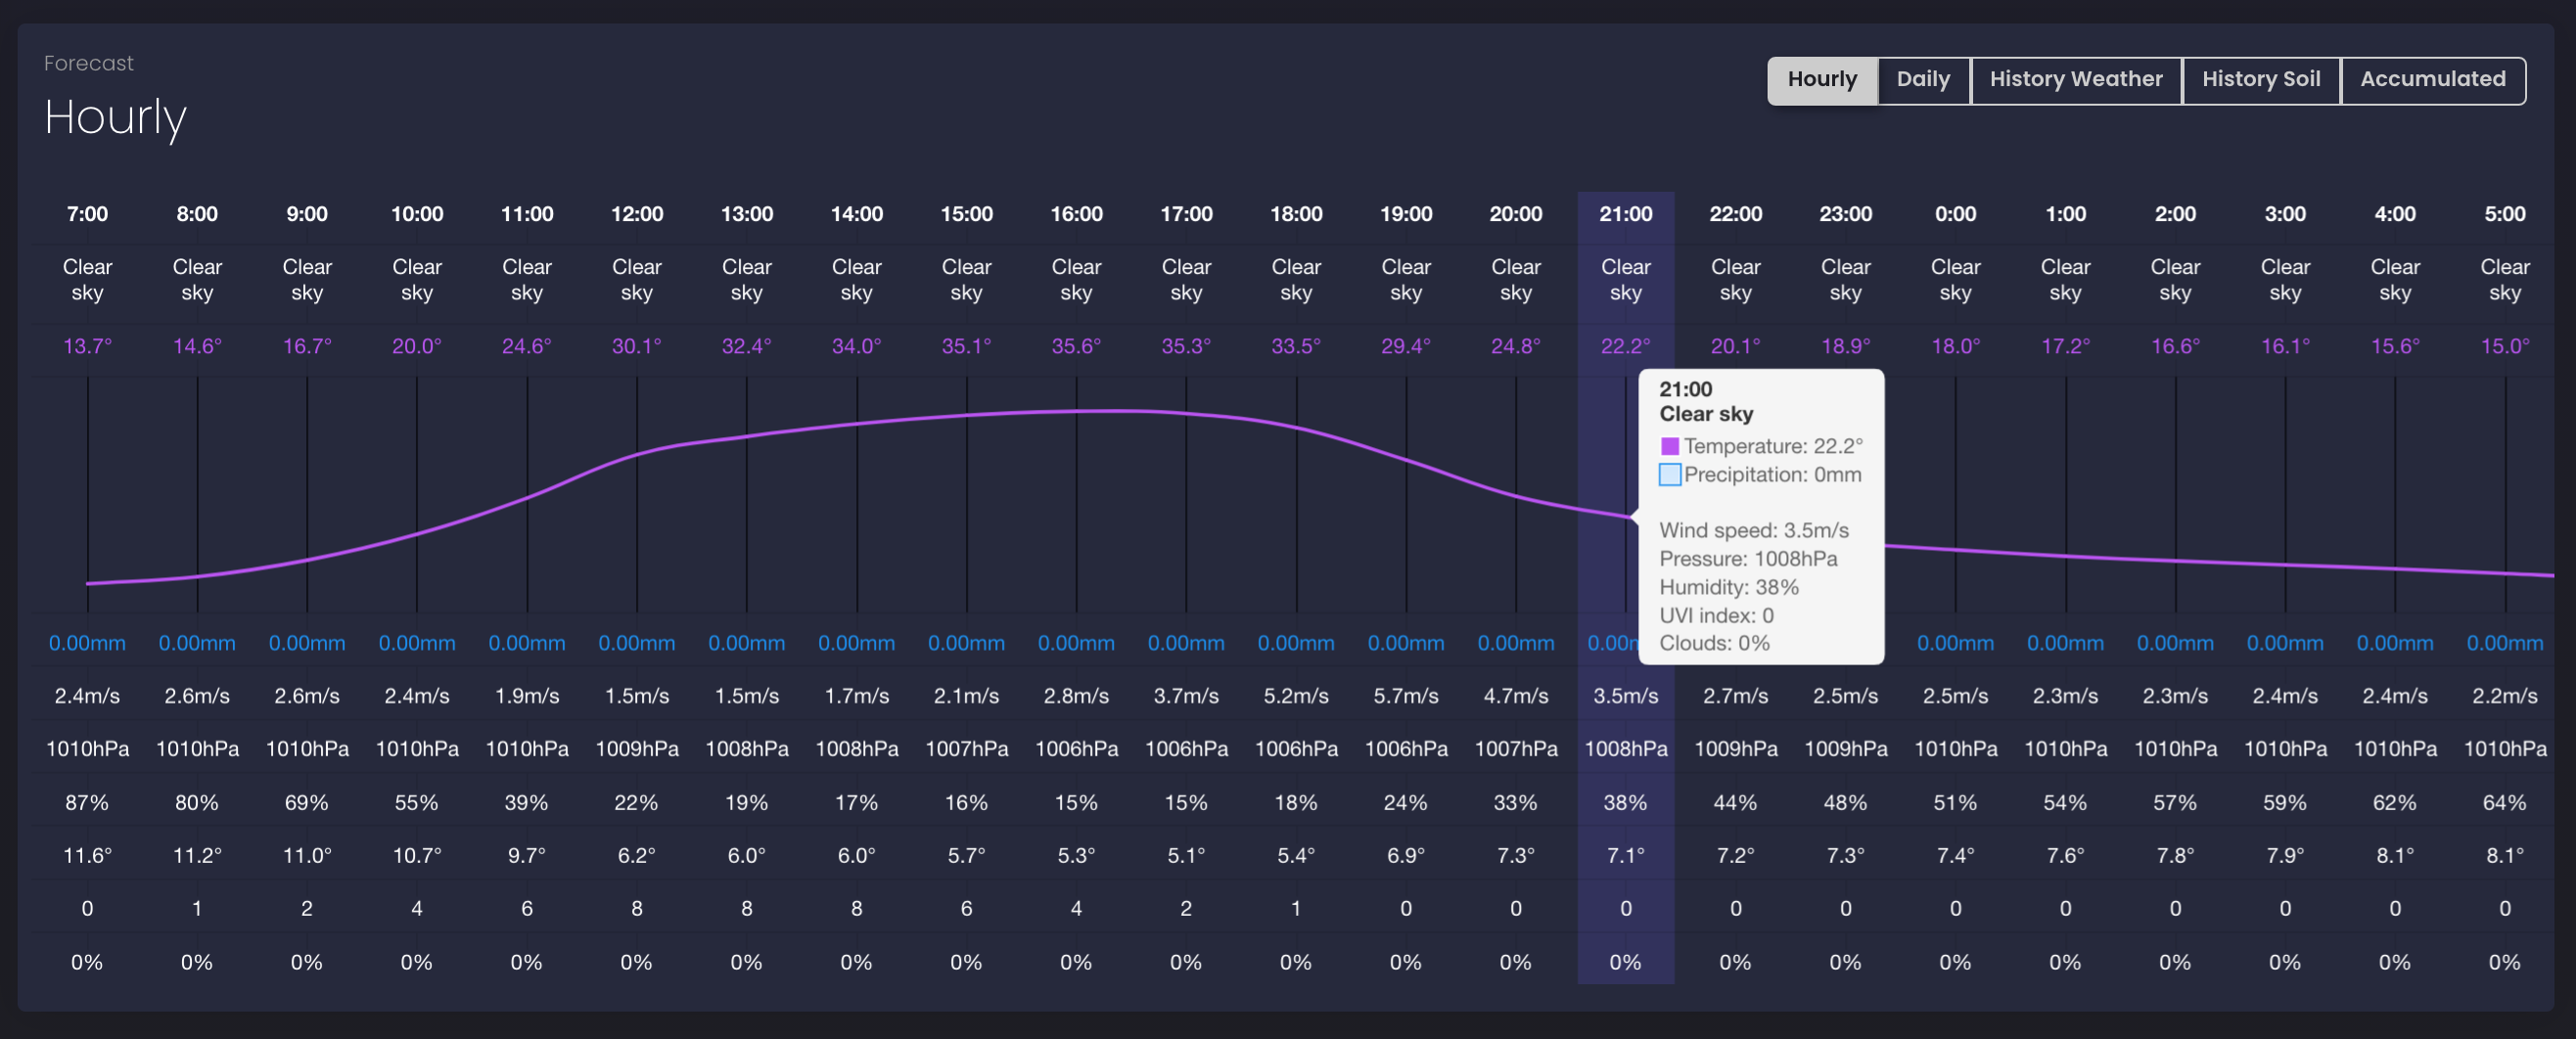
Hourly weather forecast for 2 days will be displayed for one of your polygons under the map and current data section.
2. To request weather data for another polygon select it in the right-hand section of polygons list.
-
The Hourly forecast for 2 days is displayed for chosen polygon (see the screen below)
Legend
The list of the weather data for the hourly forecast:
-
Time of the forecast
-
Temperature
-
Precipitation, mm
-
Wind speed, m/s
-
Pressure, hPa
-
Humidity, %
-
UV index
-
Cloudiness, %
Daily forecast for 8 days
1. Go to the "Weather data" section. Please read here how to get there.
-
Weather data section will be displayed for one of your polygons under the map and current data section.
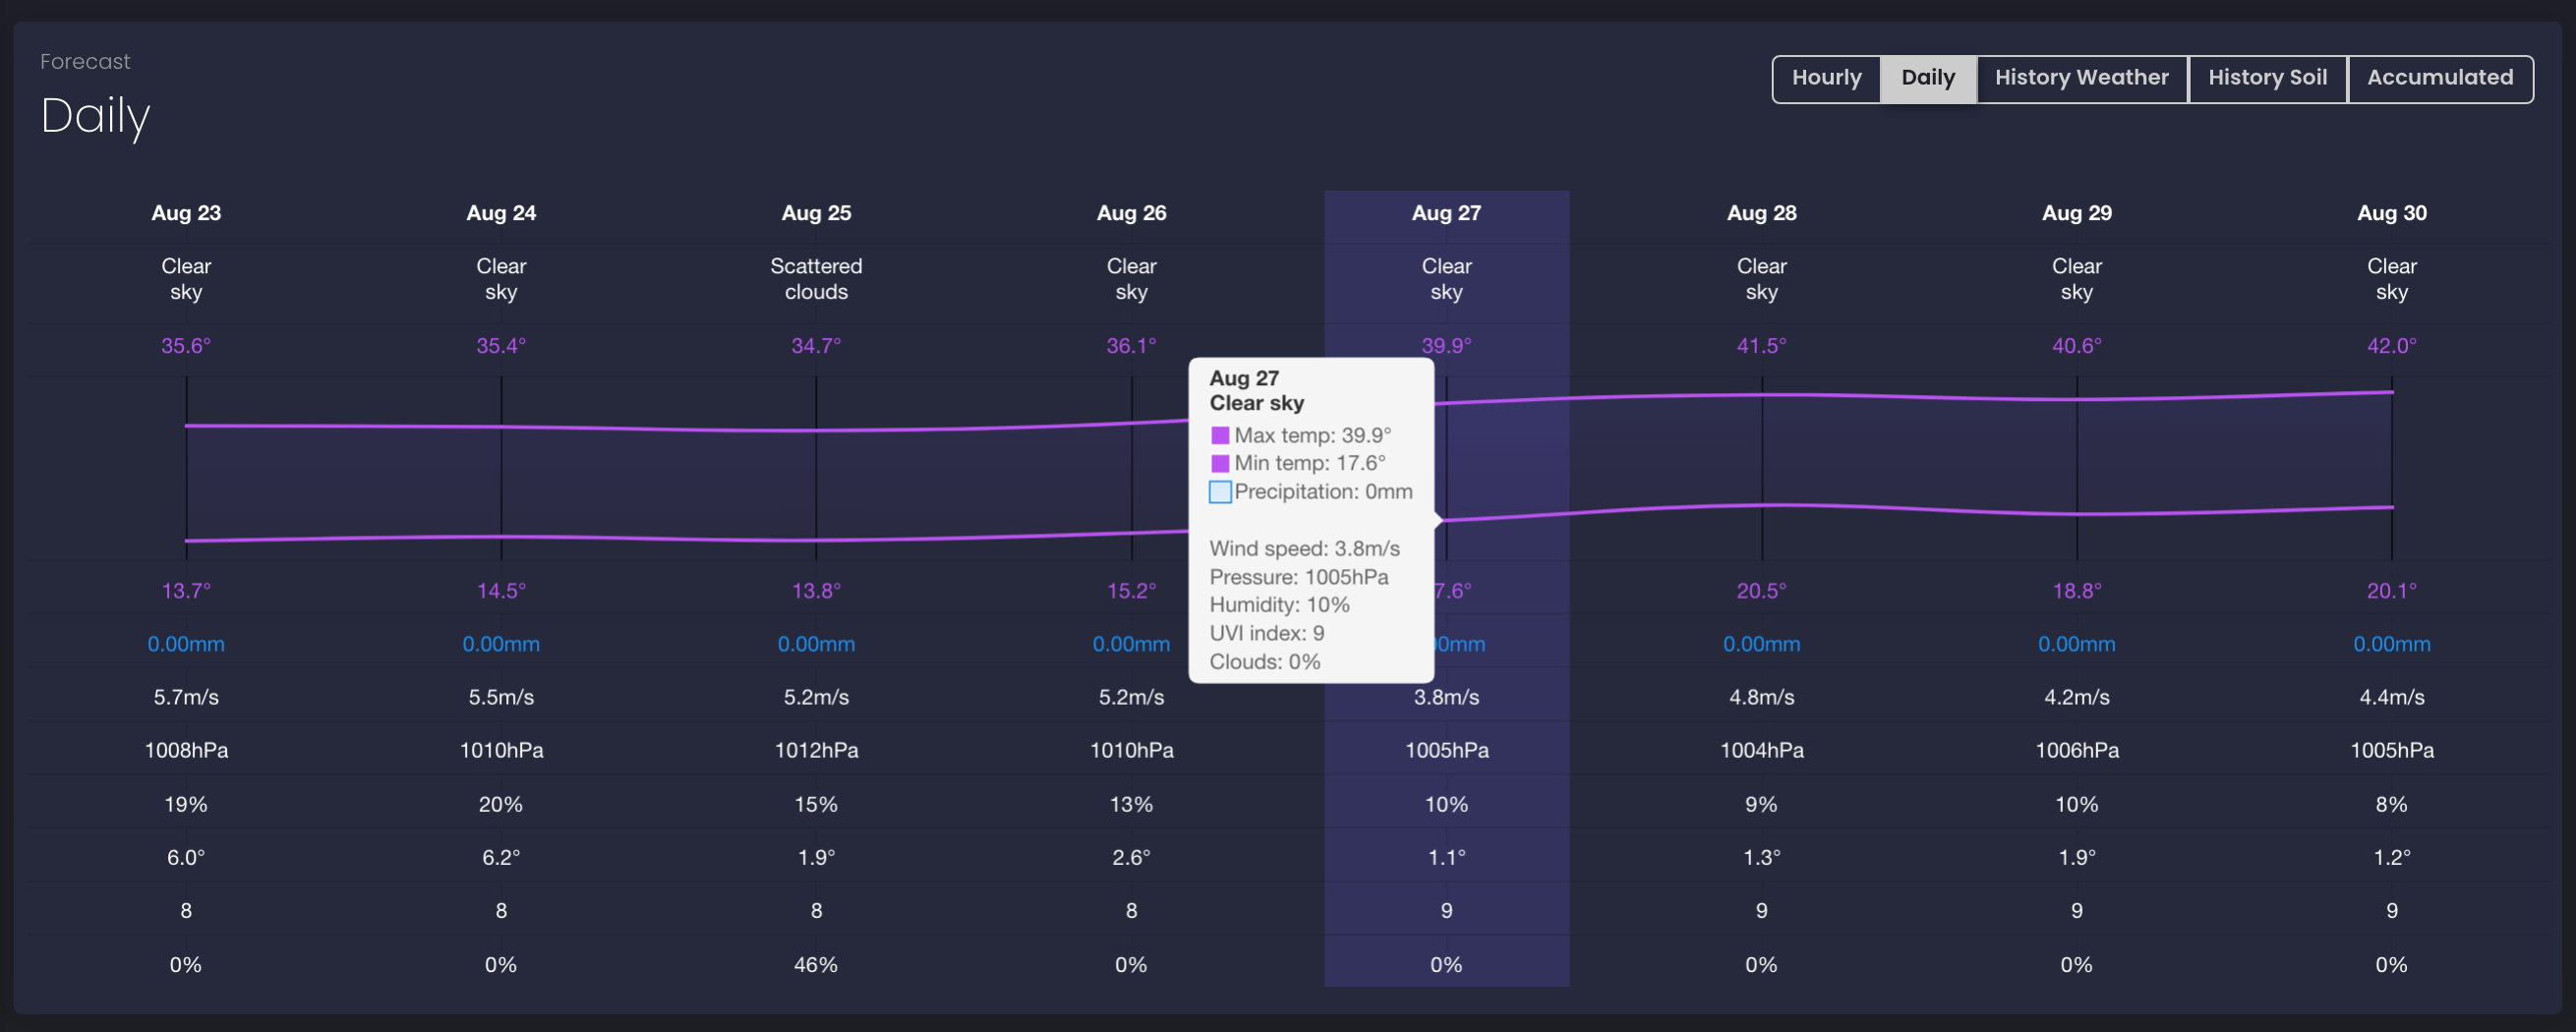
2. Click on the "Daily" tab to get daily forecast (see the screen below). When you open the "Daily" tab, you can freely switch between polygons by using the right-hand menu with the polygons list. When you switch between polygons, the "Daily" tab will be opened by default.
-
Daily weather forecast for 8 days will be displayed for the chosen polygon.
Legend
The list of the weather data for the daily forecast:
-
Date of the forecast
-
Maximal daily temperature
-
Minimal daily temperature
-
Precipitation, mm
-
Wind speed, m/s
-
Pressure, hPa
-
Humidity, %
-
UV index
-
Cloudiness, %
Historical weather data
1. Go to the "Weather data" section. Please read here how to get there.
-
Weather data section will be displayed for one of your polygons under the map and current data section.
2. Click on the "Historical weather" tab to get historical weather data (see the screenshot below). When you open the "Historical weather" tab, you can freely switch between polygons by using the right-hand menu with the polygons list. When you switch between polygons, the "Historical weather" tab will be opened by default.
-
Historical weather data will be displayed for the chosen polygon. By default, the chart is built for the last month.
3. In order to select a different time period, please use the calendar on the chart. Please find the available depth of historical data for your subscription plan on the pricing page.
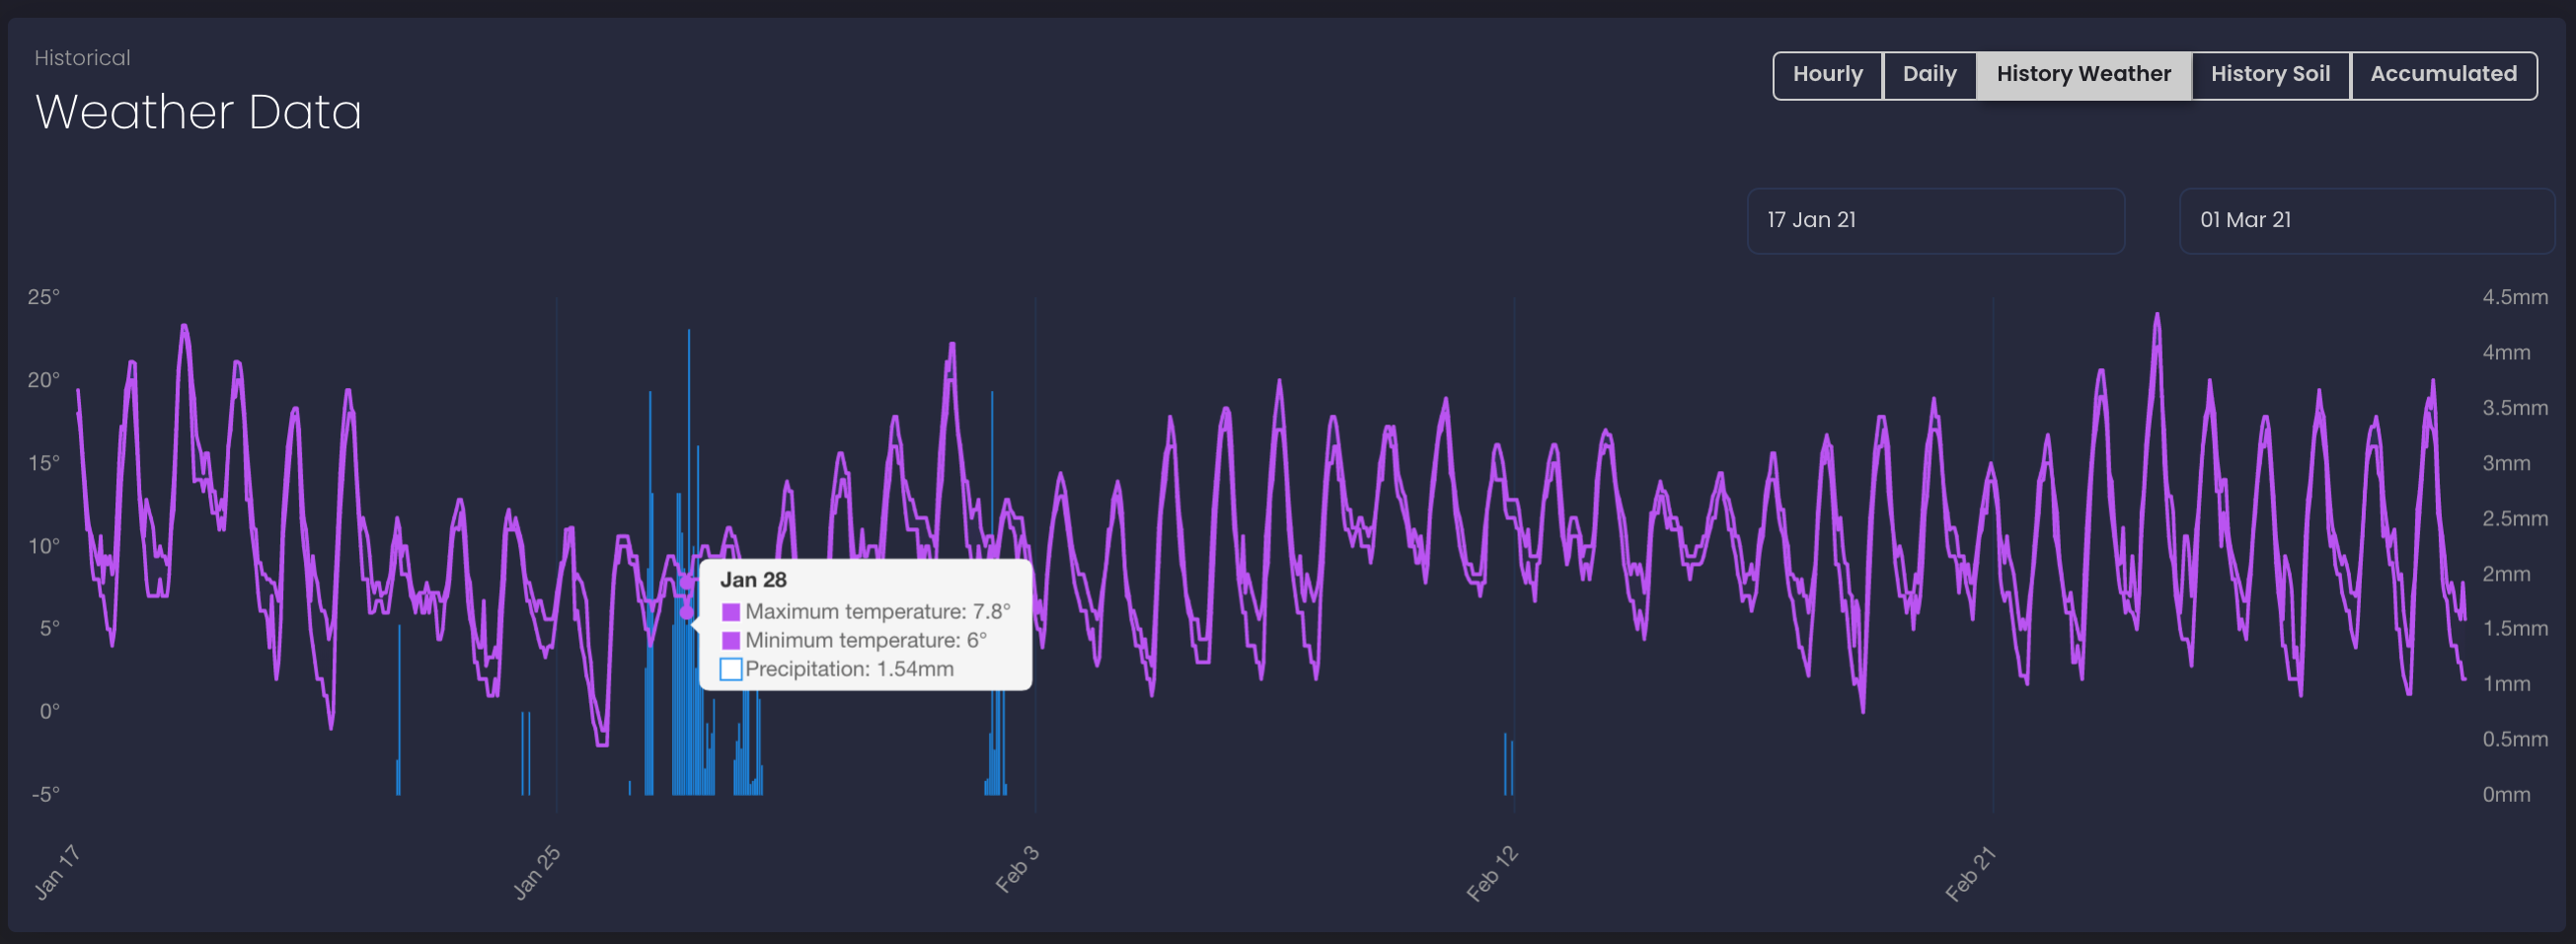
Legend
The list of the weather data for the historical weather data:
-
Date of the measurements
-
Maximal temperature
-
Minimal temperature
-
Precipitation, mm
Historical soil data
1. Go to the "Weather data" section. Please read here how to get there.
-
Weather data section will be displayed for one of your polygons under the map and current data section.
2. Click on the "History soil" tab to get historical soil data (see the screenshot below). When you open the history soil tab, you can freely switch between polygons by usung the right-hand menu with the list of polygons. When you switch between polygons, the history soil tab will be opened by default.
-
Historical soil data will be displayed for the chosen polygon. By default, the chart is built for the last month.
3. In order to select a different time period, please use the calendar on the chart. Please find the available depth of historical data for your subscription plan on the pricing page.
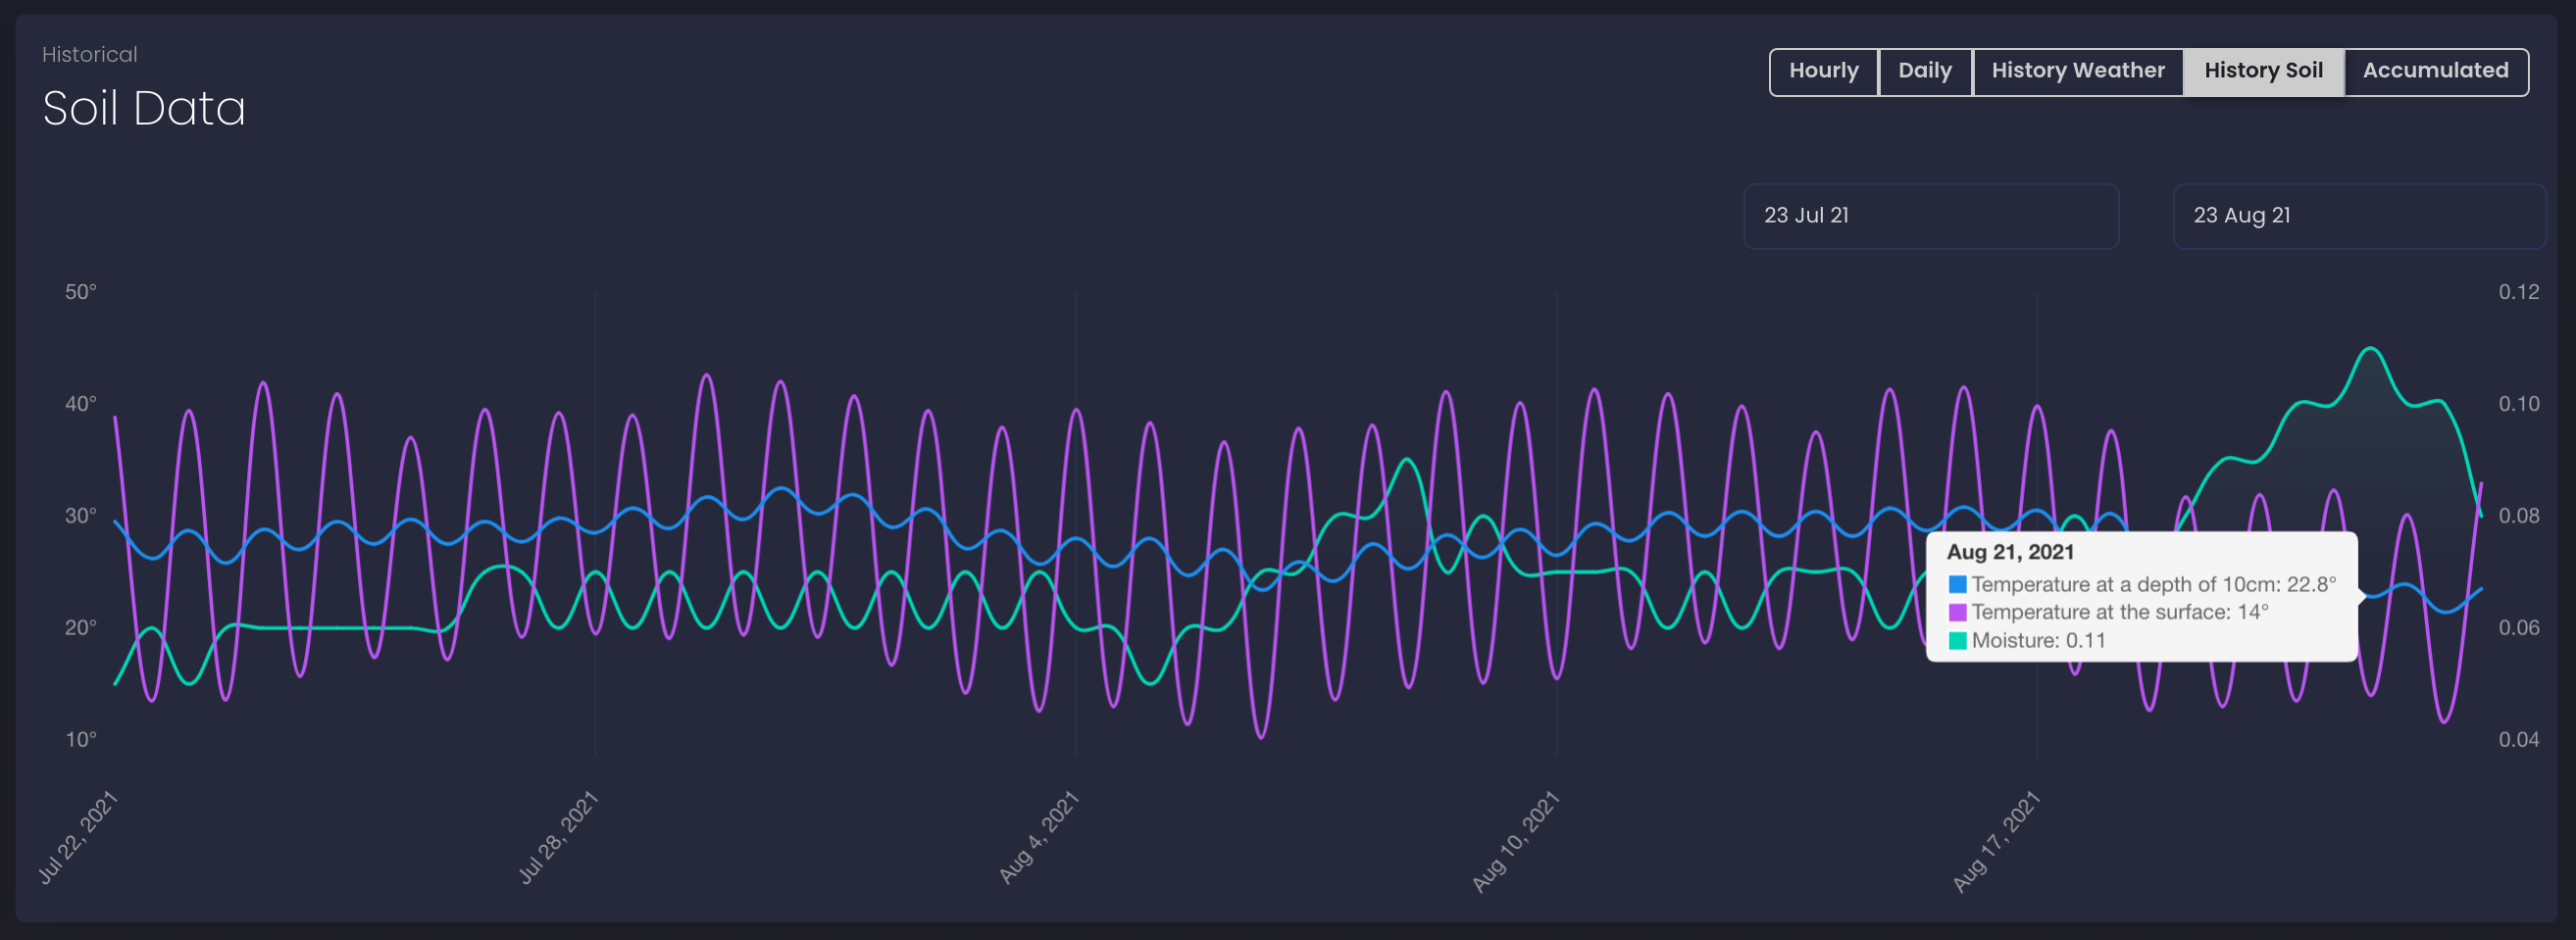
Legend
The list of the weather data for the historical soil data:
-
Date of the measurements
-
Temperature at the depth of 10cm
-
Temperature at the surface
-
Soil moisture, m3/m3
Accumulated temperature and precipitation
1. Go to the "Weather data" section. Please read here how to get there.
-
Weather data section will be displayed for one of your polygons under the map and current data section.
2. Click on the "Accumulated" tab to see accumulated temperature and precipitation data (see the screen below). When you open the "Accumulated" tab, you can freely switch between polygons by using the right-hand menu with the polygons list. When you switch between polygons, the "Accumulated" tab will be open by default.
-
Accumulated temperature and precipitation data will be displayed for the chosen polygon. By default, the chart is built for the last month.
3. To select a different time period, please use the calendar on the chart. Please find the available depth for accumulated parameters for your subscription plan on the pricing page.
4. To set up the threshold for accumulated temperature, please use the threshold field on the chart. The default threshold is 0.
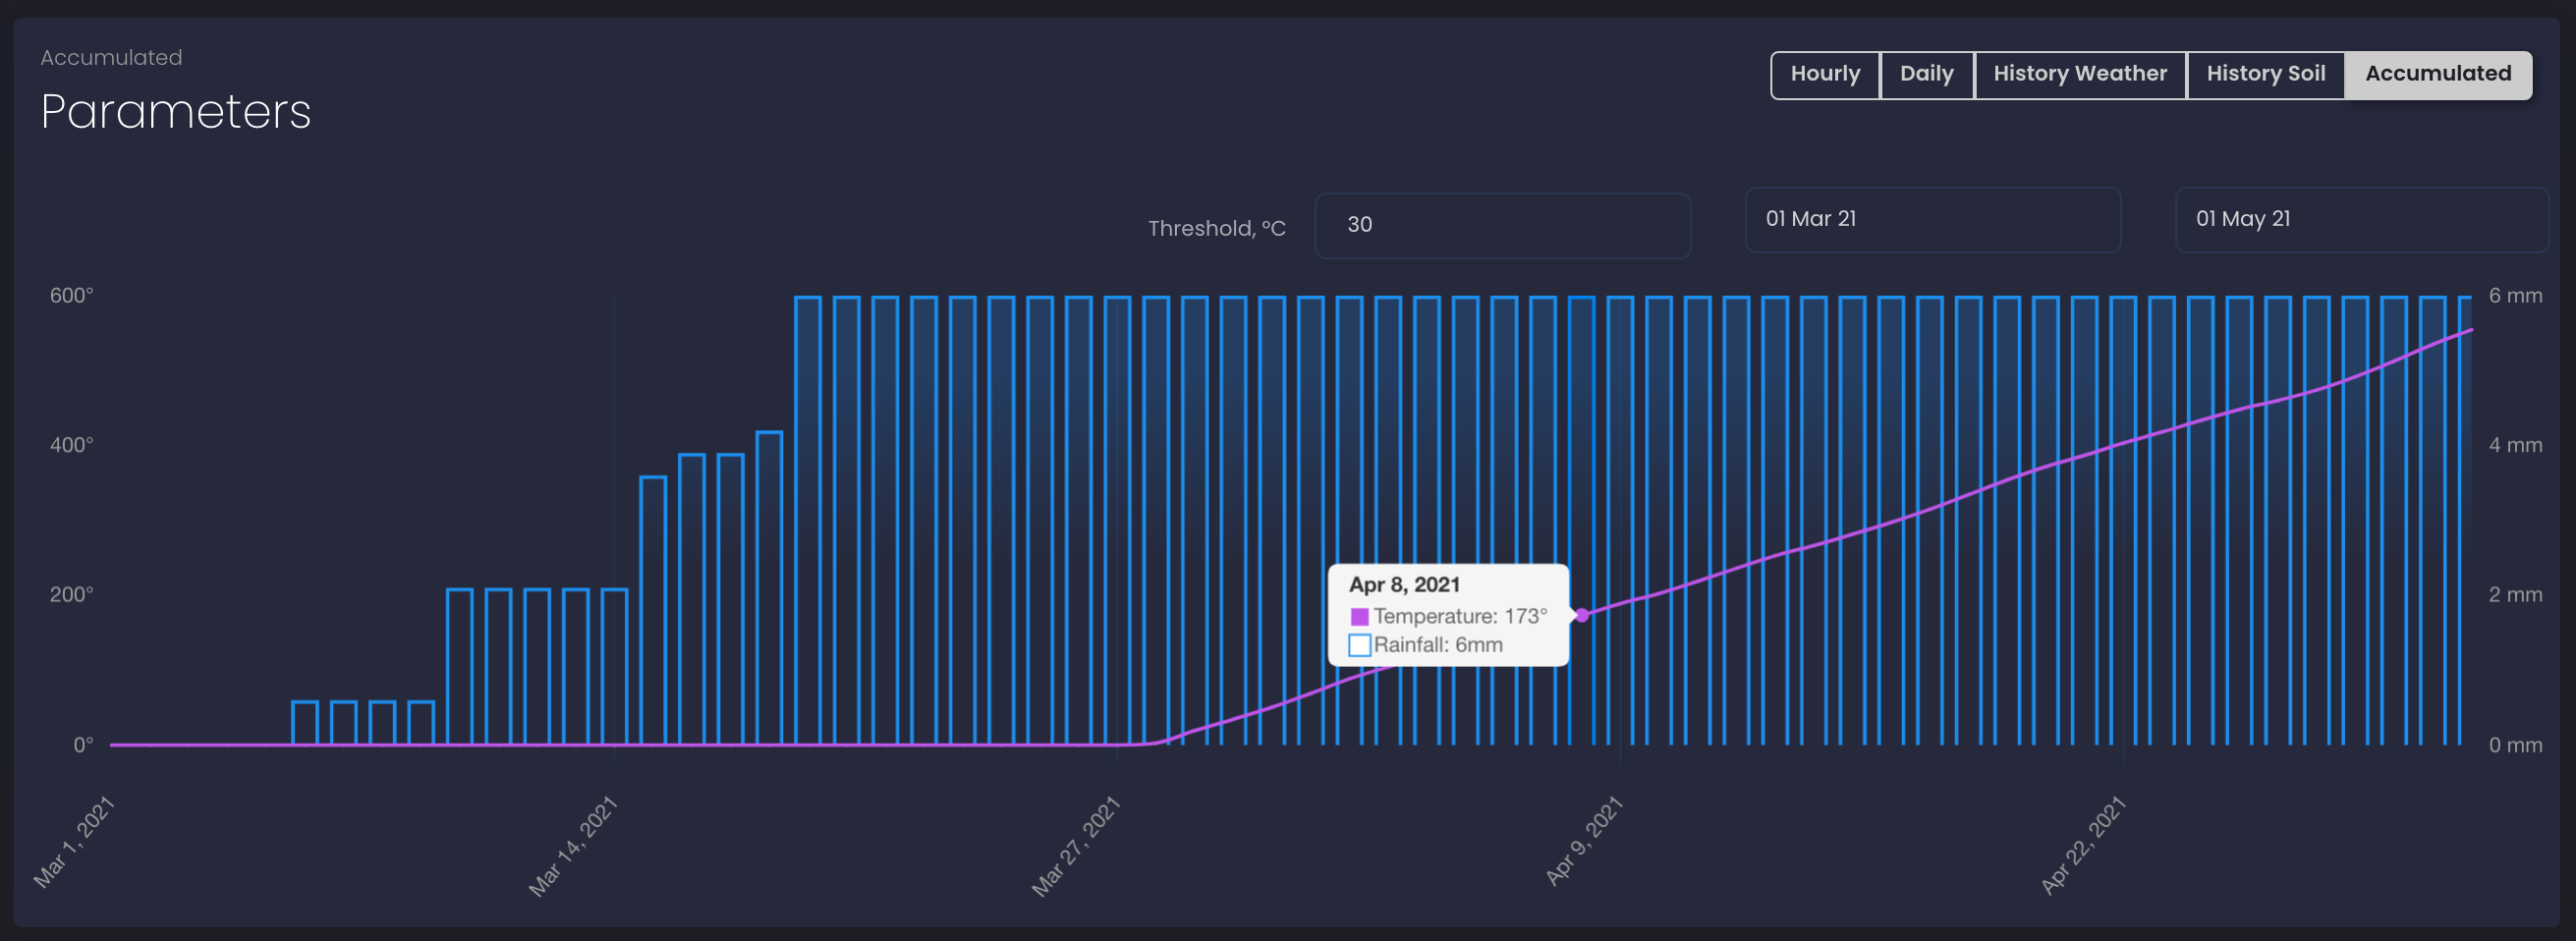
Legend
The chart displays the following types of data:
-
Temperature, the sum by which the actual air temperature rises above or falls below a threshold level over a selected period. You can find on how to manage the temperature threshold in the paragraph 4 of this section.
-
Rainfall, the accumulated amount of precipitation for the selected period.
For example, 3 mm of precipitation was observed on August 21 and 5 mm of precipitation was observed on August 22.
The chart will reflect it in the following way:
3 mm of precipitation on August 21, 3 mm + 5 mm = 8 mm of precipitation on August 22, etc.
The chart:
-
The Y-axis (left) is the numerical value of accumulated temperature.
-
The Y-axis (right) is the numerical value of accumulated rainfall.
-
The X-axis represents dates.
If you have any questions or comments, please contact us at info@openweathermap.org.