
About Crop Map section
To reach the Crop Map section please go to the left-hand menu and select the corresponding menu item.
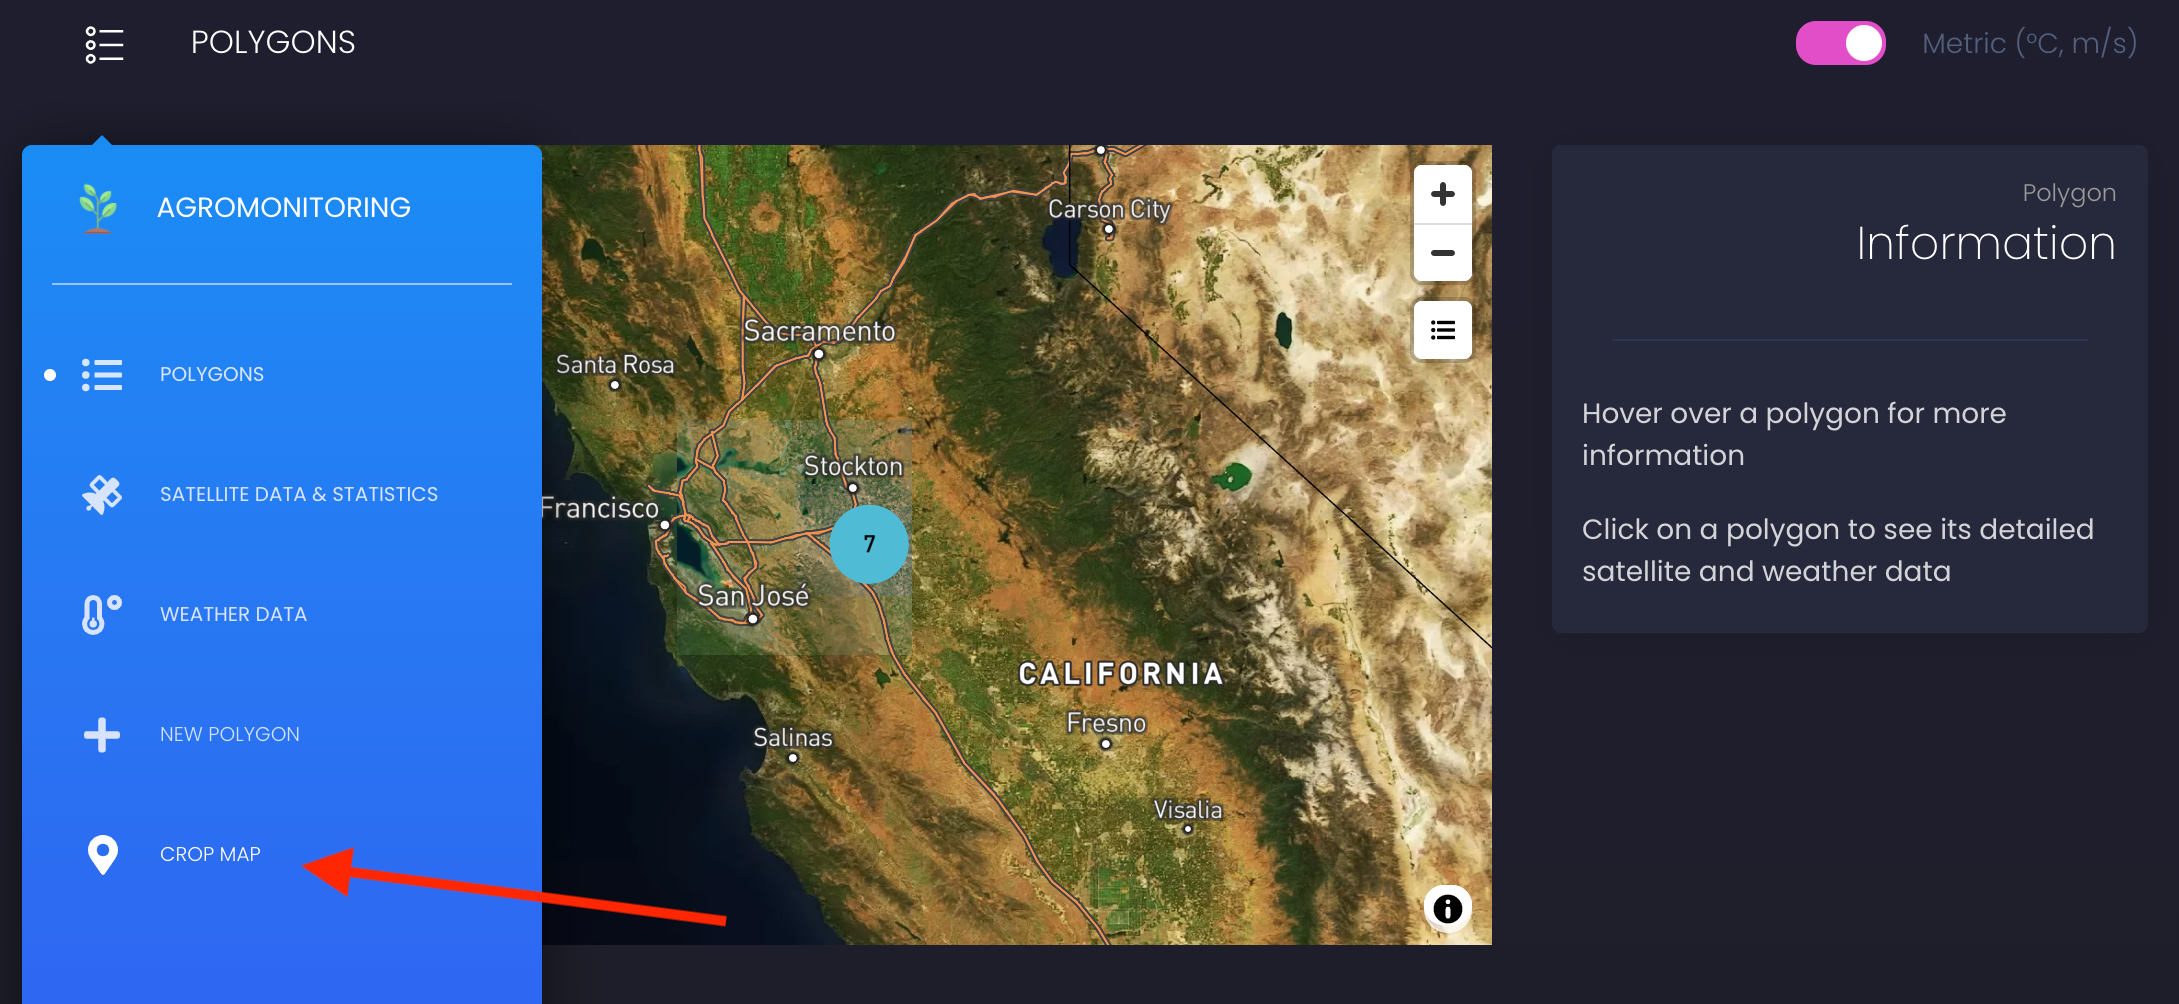
Crop Map section contains the map with already recognized boundaries of polygons and its statistics.
How to work with Crop Map
-
Go to the Crop Map section.
-
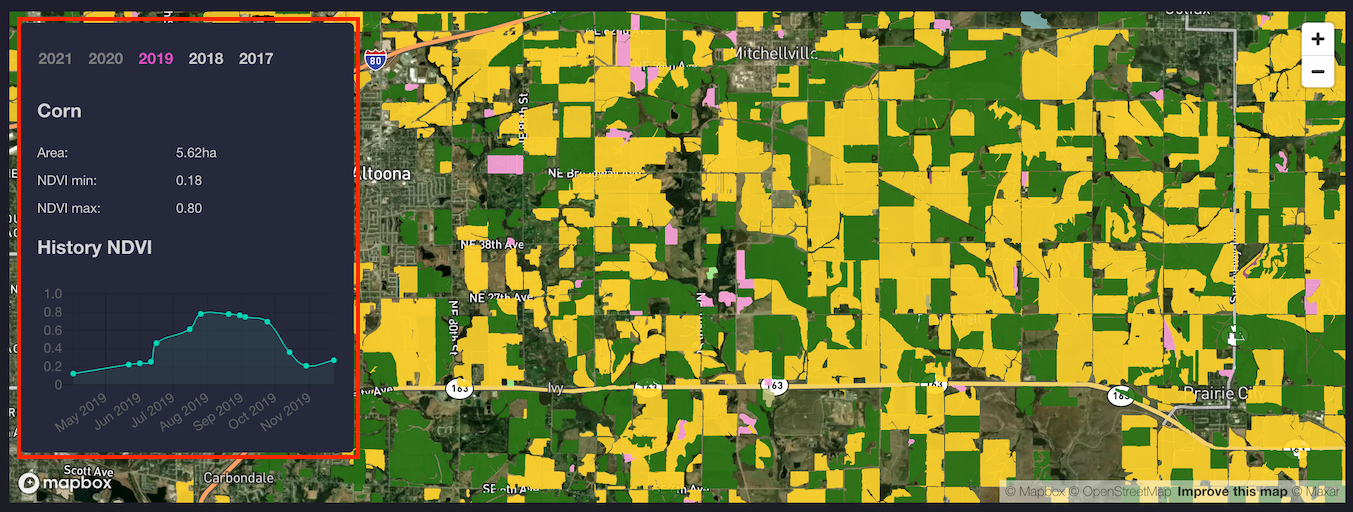
The map will display the latest available year by default. The chosen year will be highlighted on the timeline.
-
-
To view statistics for a recognized field, hover over this field with the cursor.
-
You can select another year from the timeline to see the Crop Map and statistics for the corresponding year.
-
The Crop Map will be displayed for the chosen year.
-
Legend
Information for the chosen polygon:
-
Years timeline - contains the list of available years of recognized crop fields.
-
Name of the crop for the chosen field.
-
Field statistics:
-
Area - total area for the chosen field, hectares.
-
NDVI min - the minimum value of the NDVI index for the chosen field.
-
NDVI max - the maximum value of the NDVI index for the chosen field.
-
NDVI chart showing the dynamics of changes in the index for a season.
If you have any questions or comments, please contact us at info@openweathermap.org.