
About the Satellite Data & Statistics section
There are several ways to get to the section:
-
Go to the left-hand menu and choose the "Satellite data & Statistics" section
-
While you are on the "My polygons" section, click on a polygon on the map or click on any line in the list of polygons
-
While you are on the "Weather data" section, click on the satellite icon in the list of polygons section (see the screenshot below)
![]()
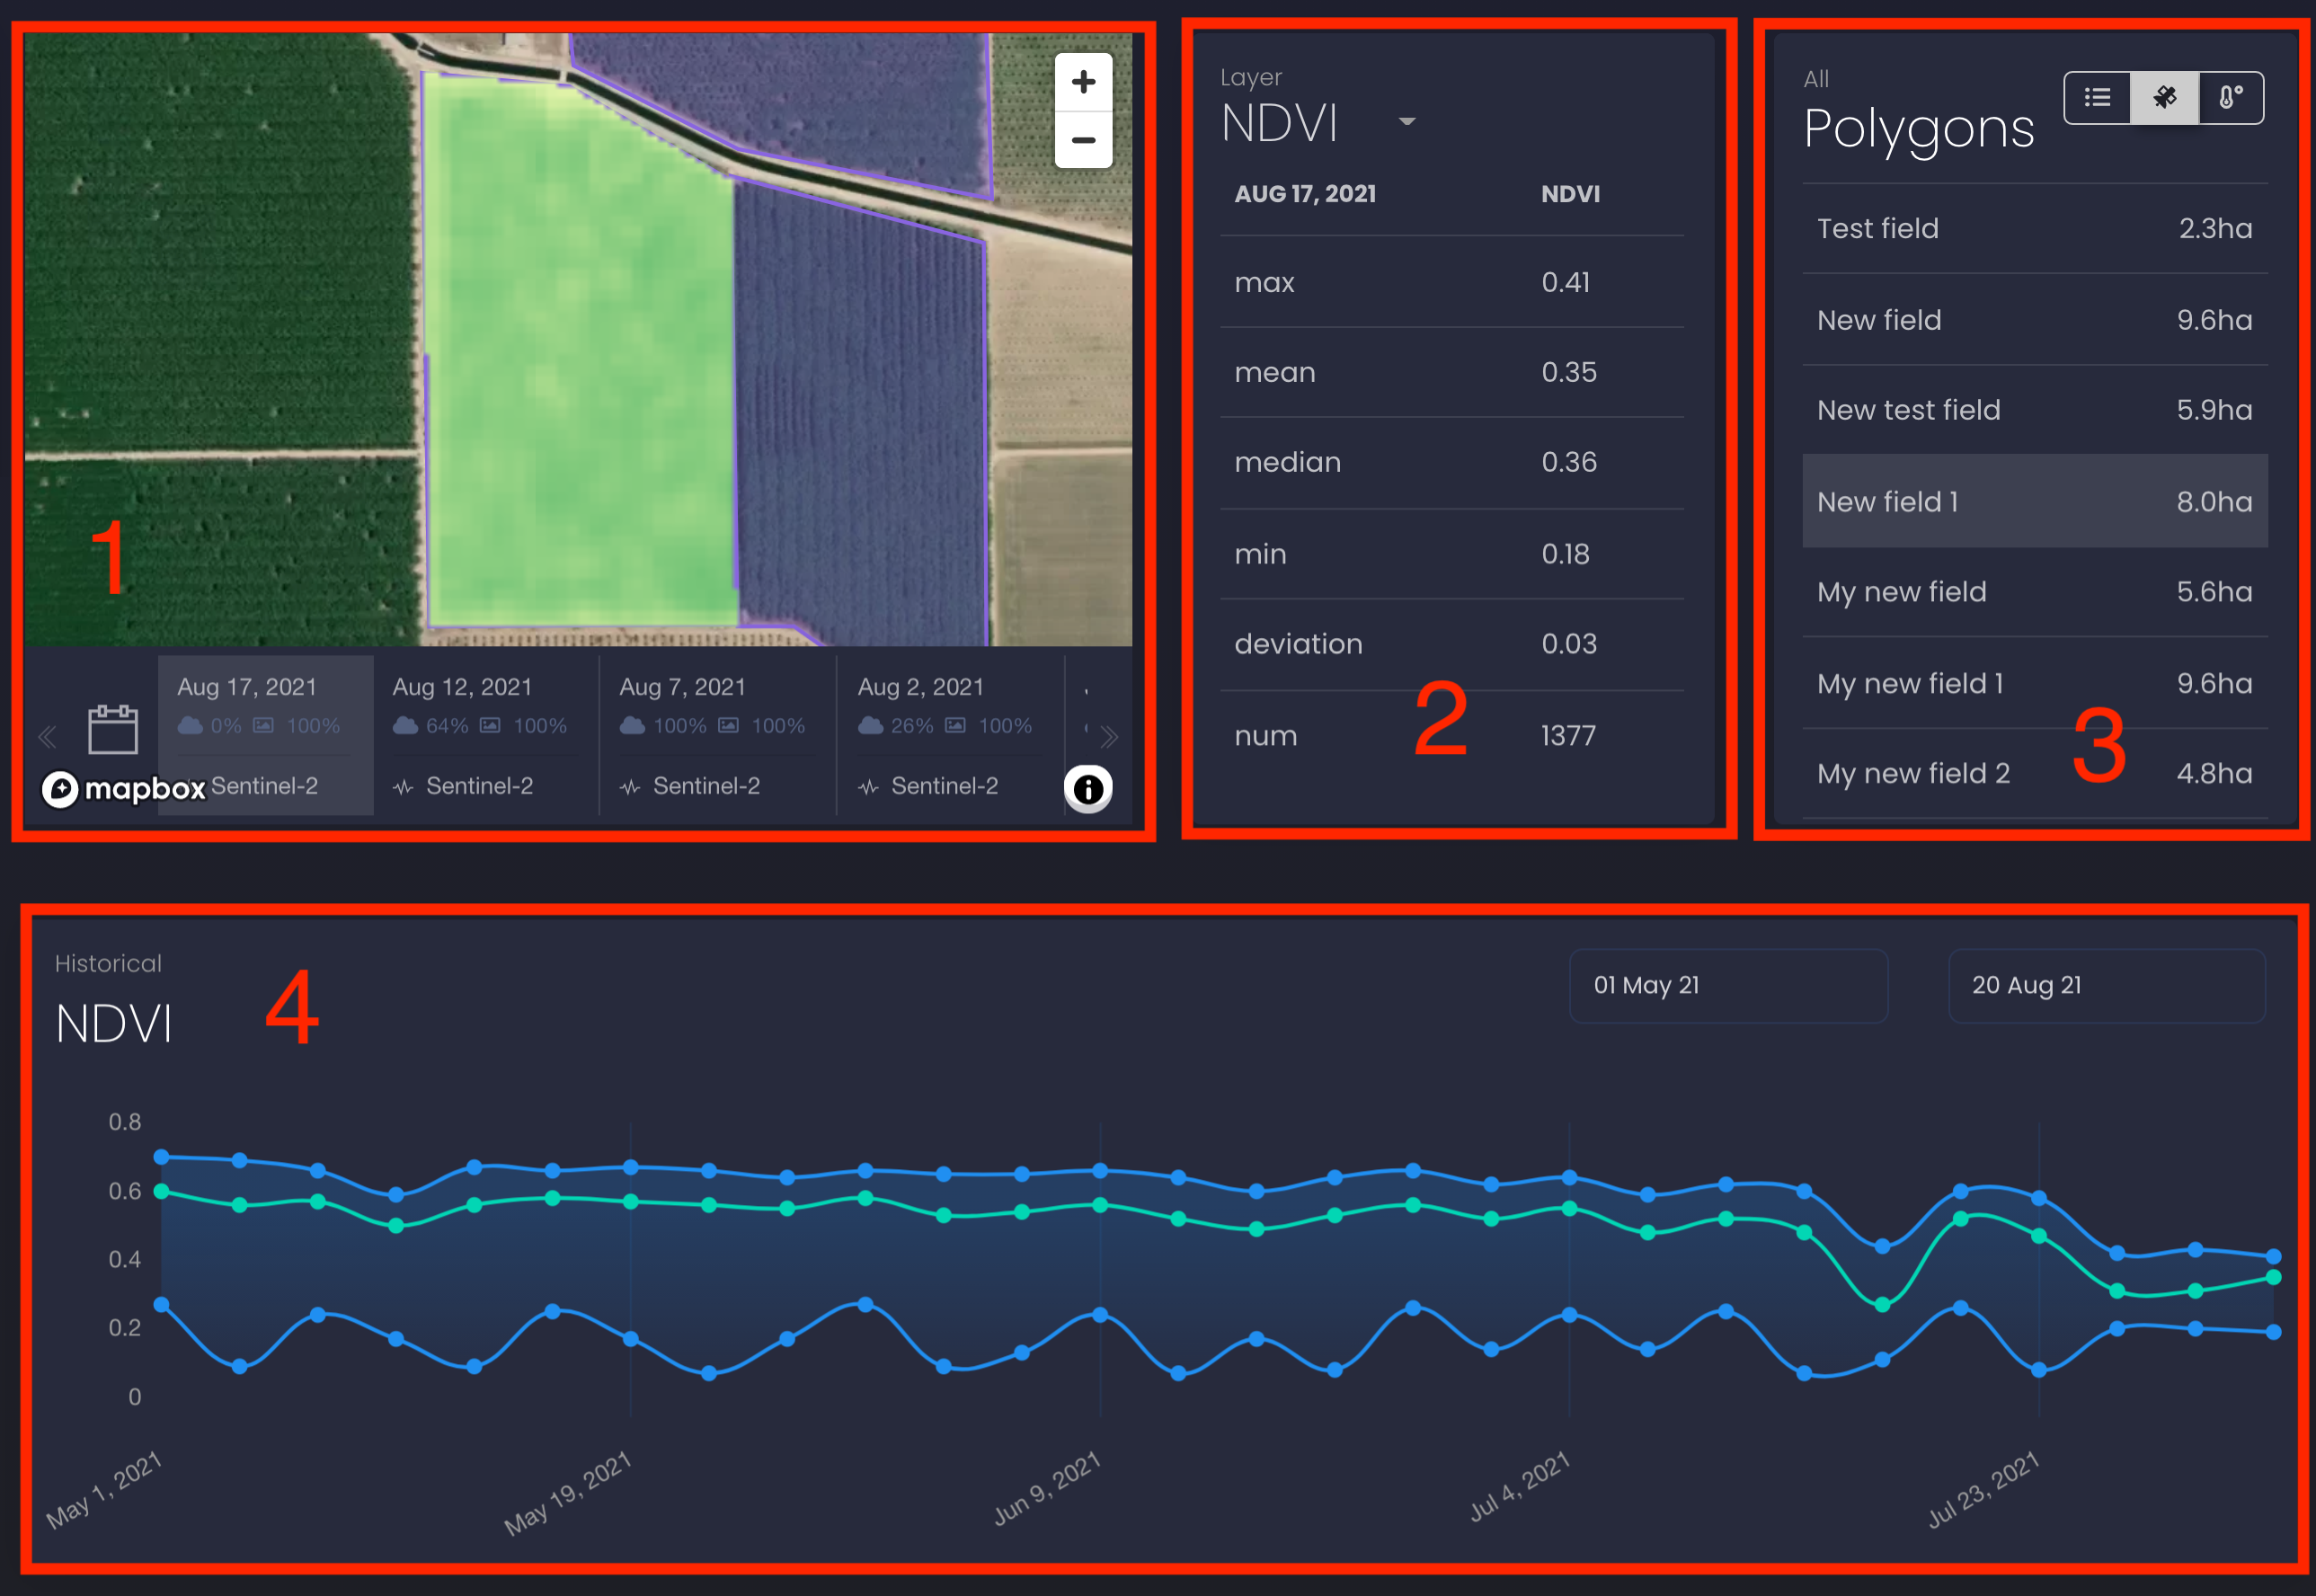
"Satellite data & Statistics" section contains the following:
-
A map with polygons
-
Vegetation indices statistics
-
A polygons list
-
An NDVI chart
Satellite imagery
1. Go to the "Satellite data & Statistics" section. Please read here how to get there.
-
On the map, you will see the most recent satellite imagery for one of your polygons.
2. You can choose another polygon by using the right-hand section with a polygon list or click on a polygon on the map.
-
On the map, you get the most recent satellite imagery for the chosen polygon.
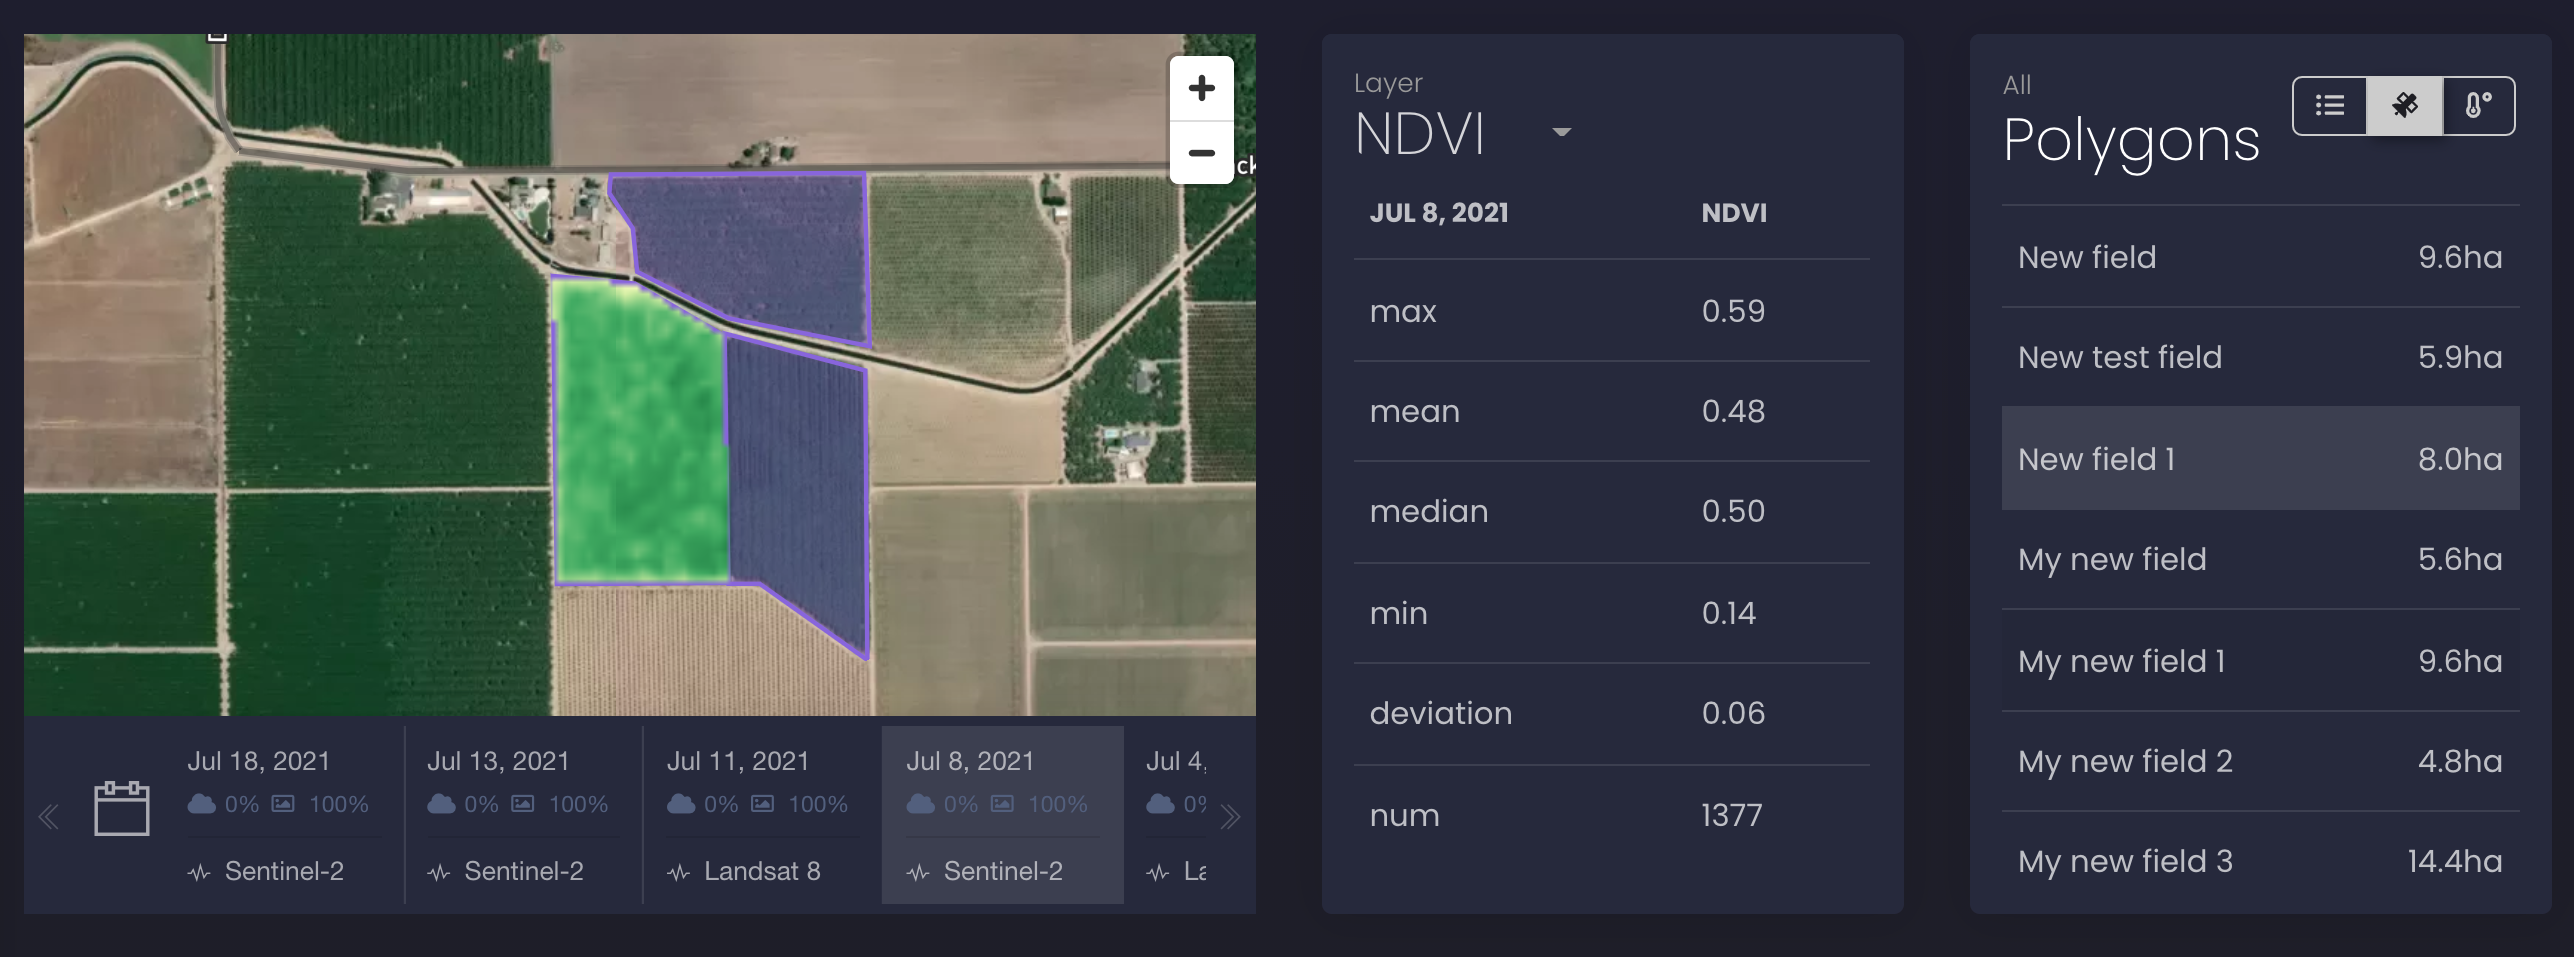
3. Use the date line under the map for choosing another satellite imagery and click on the selected imagery.
For each satellite imagery, the date line displays the following:
-
Date of creation
-
Cloudiness
-
Resolution (m/px)
-
Source (Landsat-8, Sentinel-2)
You can scroll this line left to get earlier images for the selected polygon.
-
The selected imagery will be shown on the map and values in the statistics will be recalculated for the selected day.
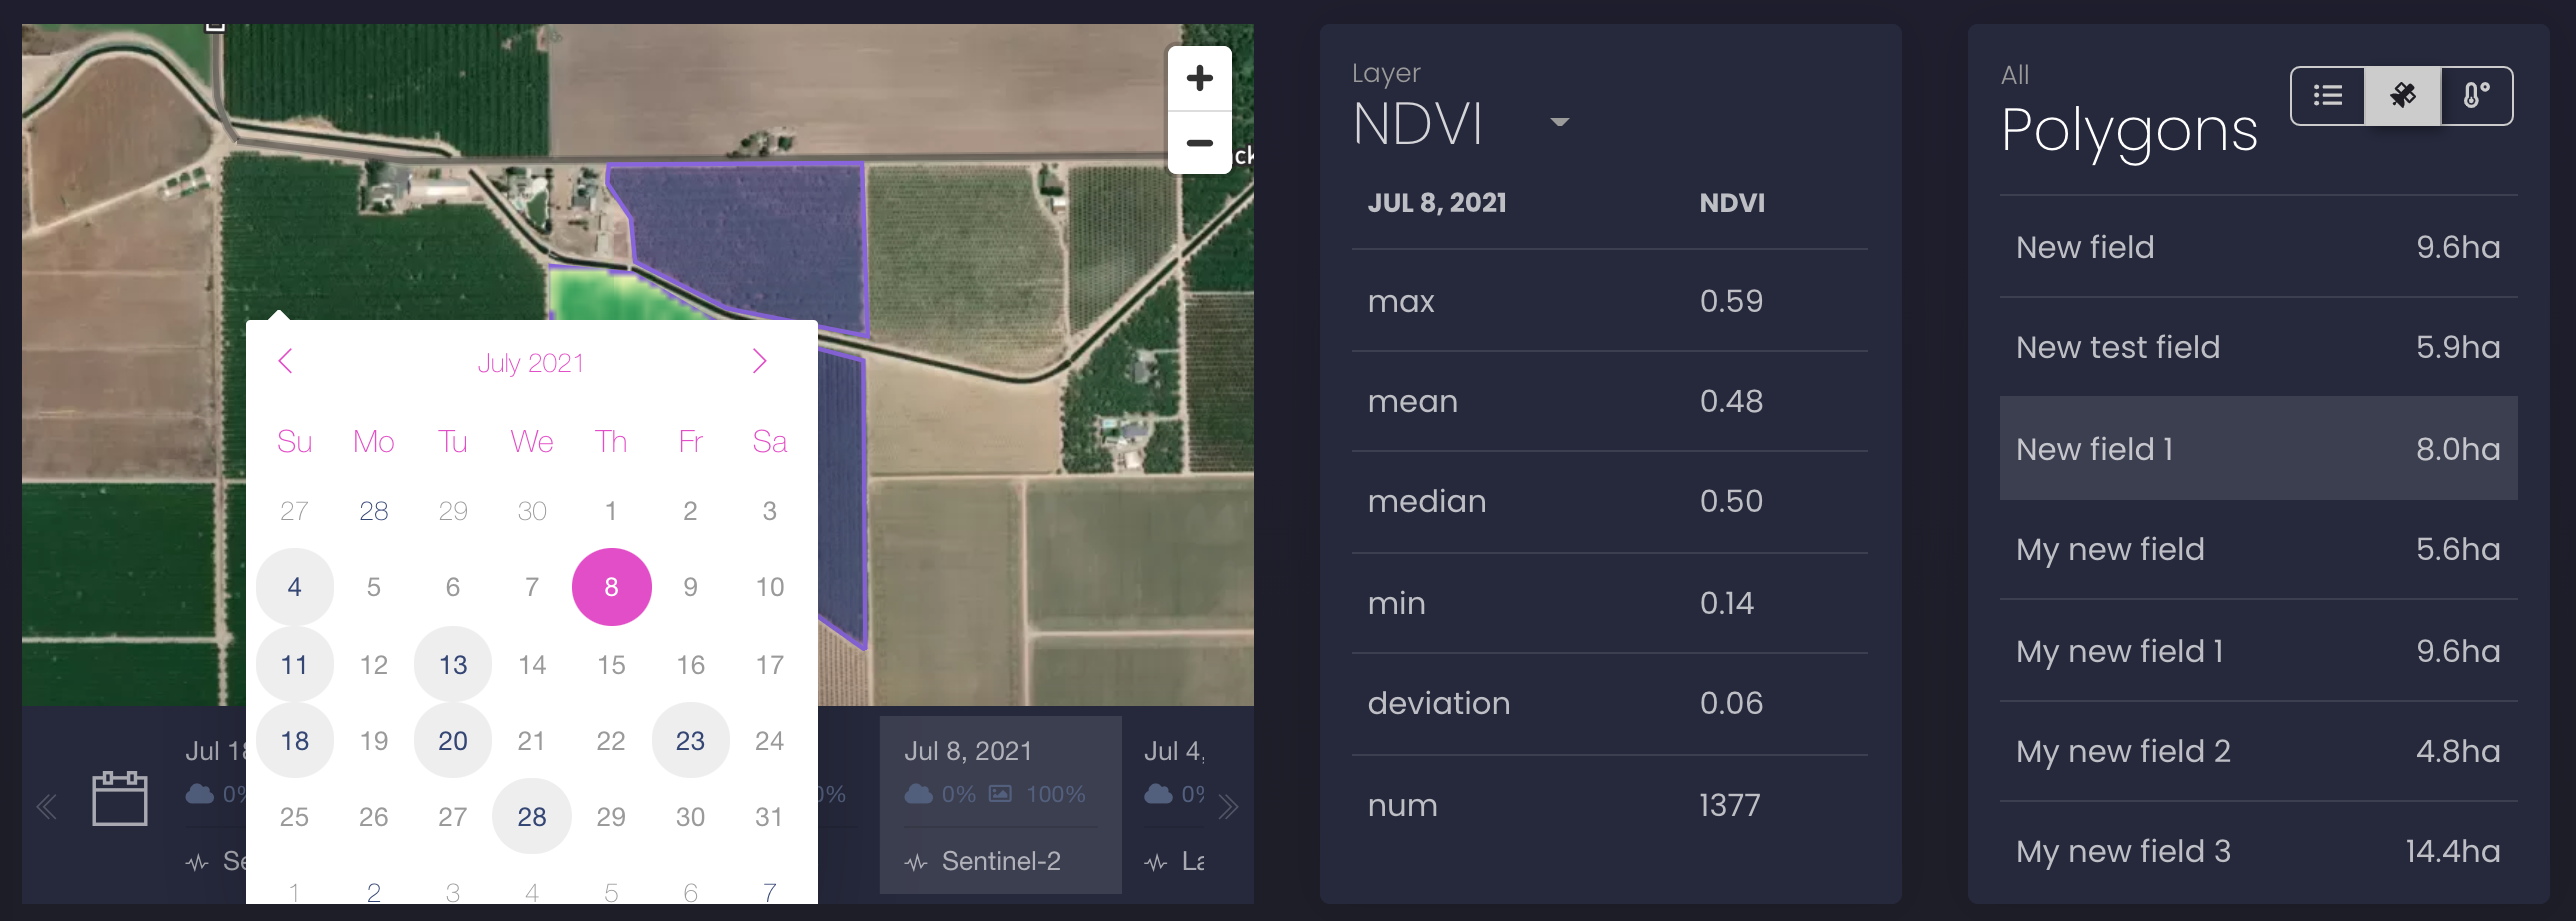
4. In case you are looking for satellite imagery from much earlier dates, you can use the calendar.
Calendar will show the specific dates with available imagery (see the screenshot below).
Satellite imagery layers and vegetation indices statistics
How to work with layers of satellite imagery and satellite indices statistics:
1. Go to the "Satellite data & Statistics" section. Please read here how to get there.
-
On the map, you will see the most recent satellite imagery for one of your polygons.
-
Indices statistics section will show indices statistics for the displayed satellite imagery.
2. You can choose another polygon by using the right-hand section with a polygon list or click on a polygon on the map.
-
On the map, you get the most recent satellite imagery for the chosen polygon.
3. Use the date line under the map or calendar to choose another satellite imagery.
-
The selected imagery will be shown on the map and indices statistics will be recalculated for the selected satellite imagery.
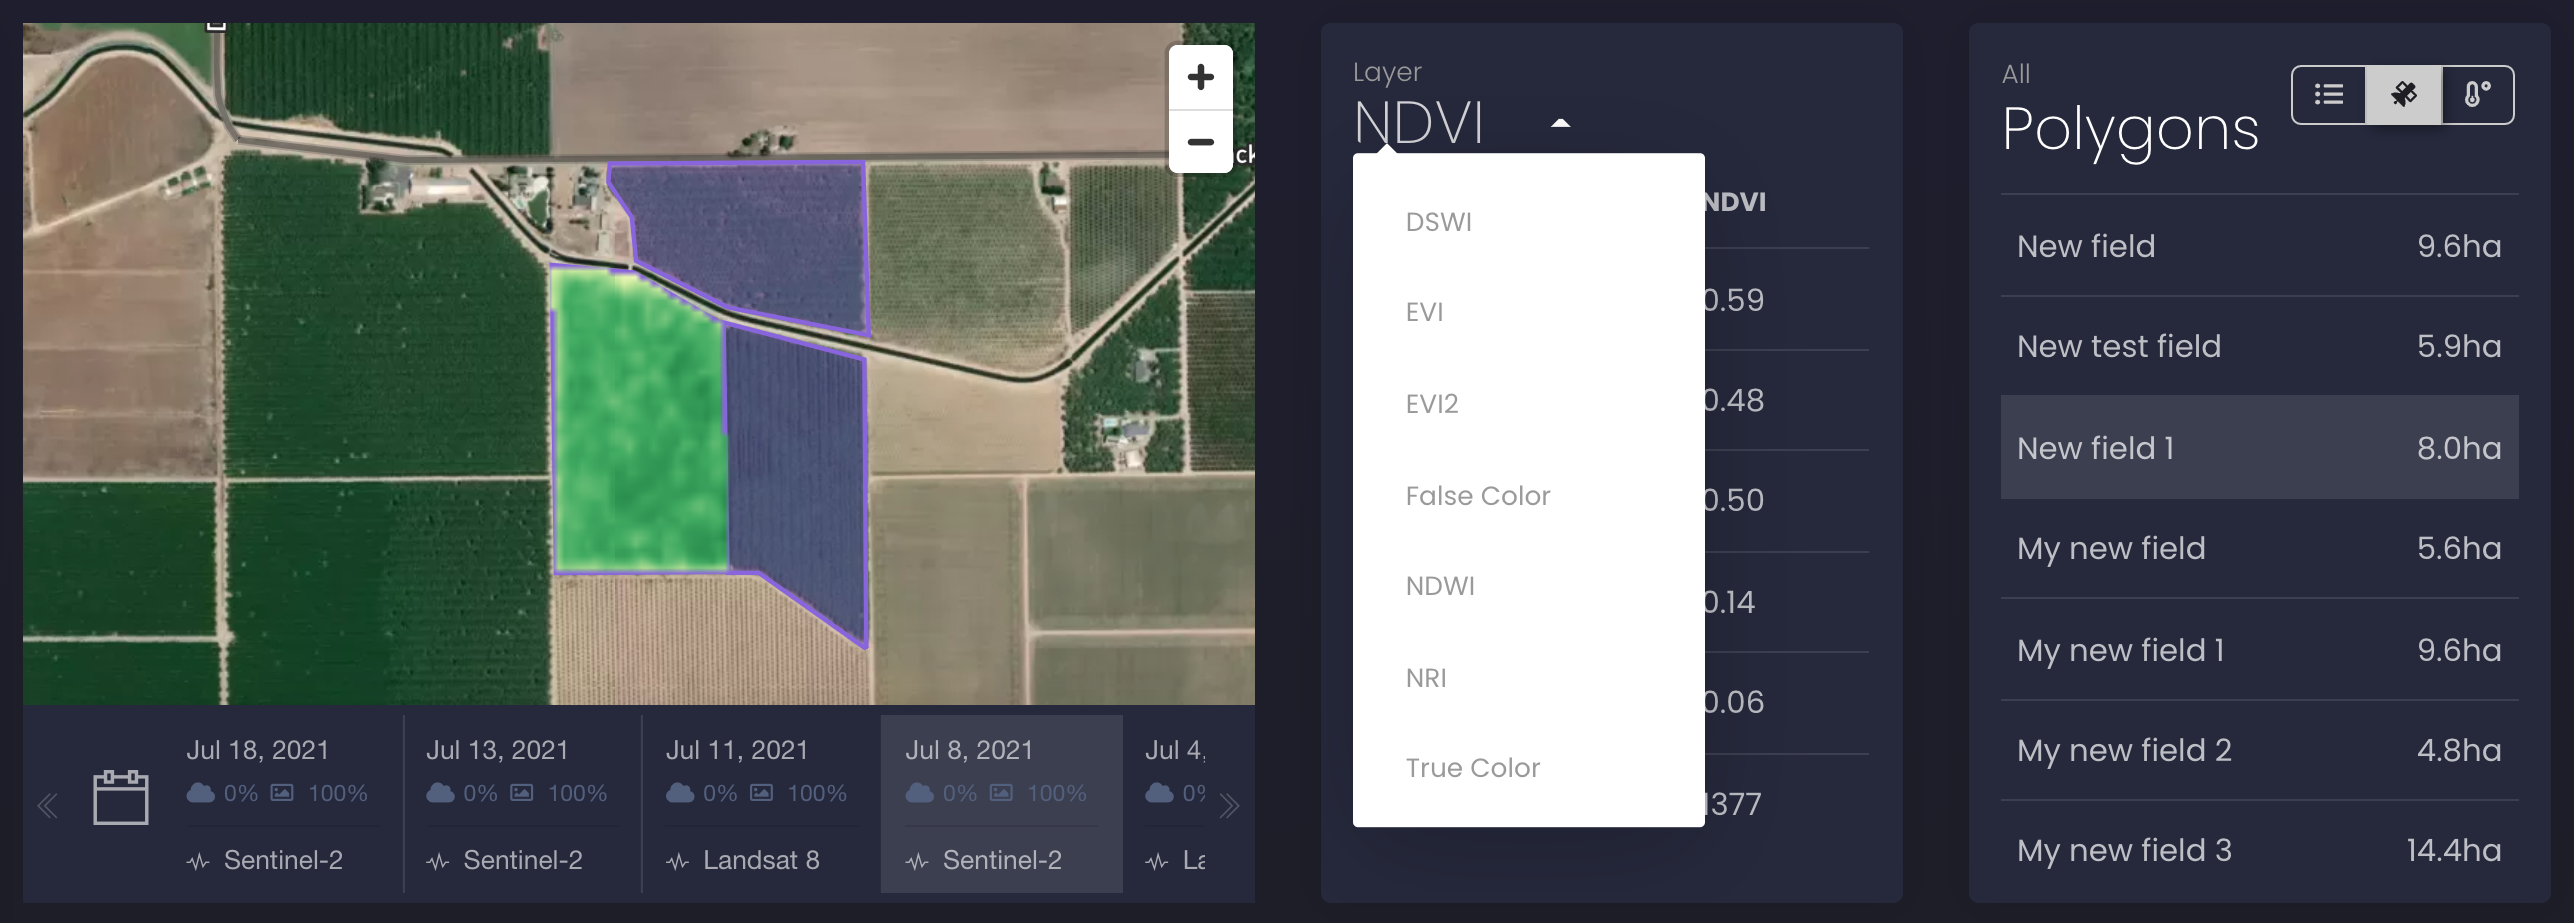
4. Choose a layer by using the drop-down menu in the indices statistics section (see the screenshot below).
-
The satellite imagery will be shown in the selected layer on the map.
-
The satellite indices statistics will be calculated for the selected name of layer.
Legend for the vegetation indices section
Below is a full list of available layers. The vegetation index corresponds to a specific layer of an imagery (e.g NDVI).
-
NDVI - Normalized Difference Vegetation Index.
-
EVI - Enhanced Vegetation Index.
-
EVI2 - 2-band Enhanced Vegetation Index.
-
NDWI - Normalized Difference Water Index.
-
NRI - Nitrogen Reflectance Index.
-
DSWI - Disease-Water Stress Index.
-
True colour.
-
False colour.
Please note that some layers or indices might be not available for all polygons.
For each satellite imagery, the indices statistics include the following parameters:
-
Max - the maximum value of an index (the third quartile value of an index)
-
Mean - the average value of an index
-
Median - the middle number in a sorted list of an index values
-
Min - the minimum value of an index (the first quartile value of an index)
-
Deviation - the standard deviation of an index
-
Num - the number of pixels for which an index is calculated
NDVI history chart
1. Go to the "Satellite data & Statistics" section. Please read here how to get there.
-
On the map, you will see the most recent satellite imagery for one of your polygons.
-
The historical NDVI chart for the selected polygon is shown under the map.
2. Click on the selected polygon.
-
The historical NDVI chart for the selected polygon is shown under the map (displayed below).
The chart displays the three curves:
-
Max - the maximum value for the NDVI index (the third quartile value of the index)
-
Mean - the average value of the NDVI index
-
Min - the minimum value of the NDVI index (the first quartile value of the index)
3. By default, the chart is built for the last month. To select other dates for displaying a historical NDVI chart, use the calendar on the chart (see the screenshot below). You can find the available depth of historical NDVI data for your subscription plan on the pricing page.
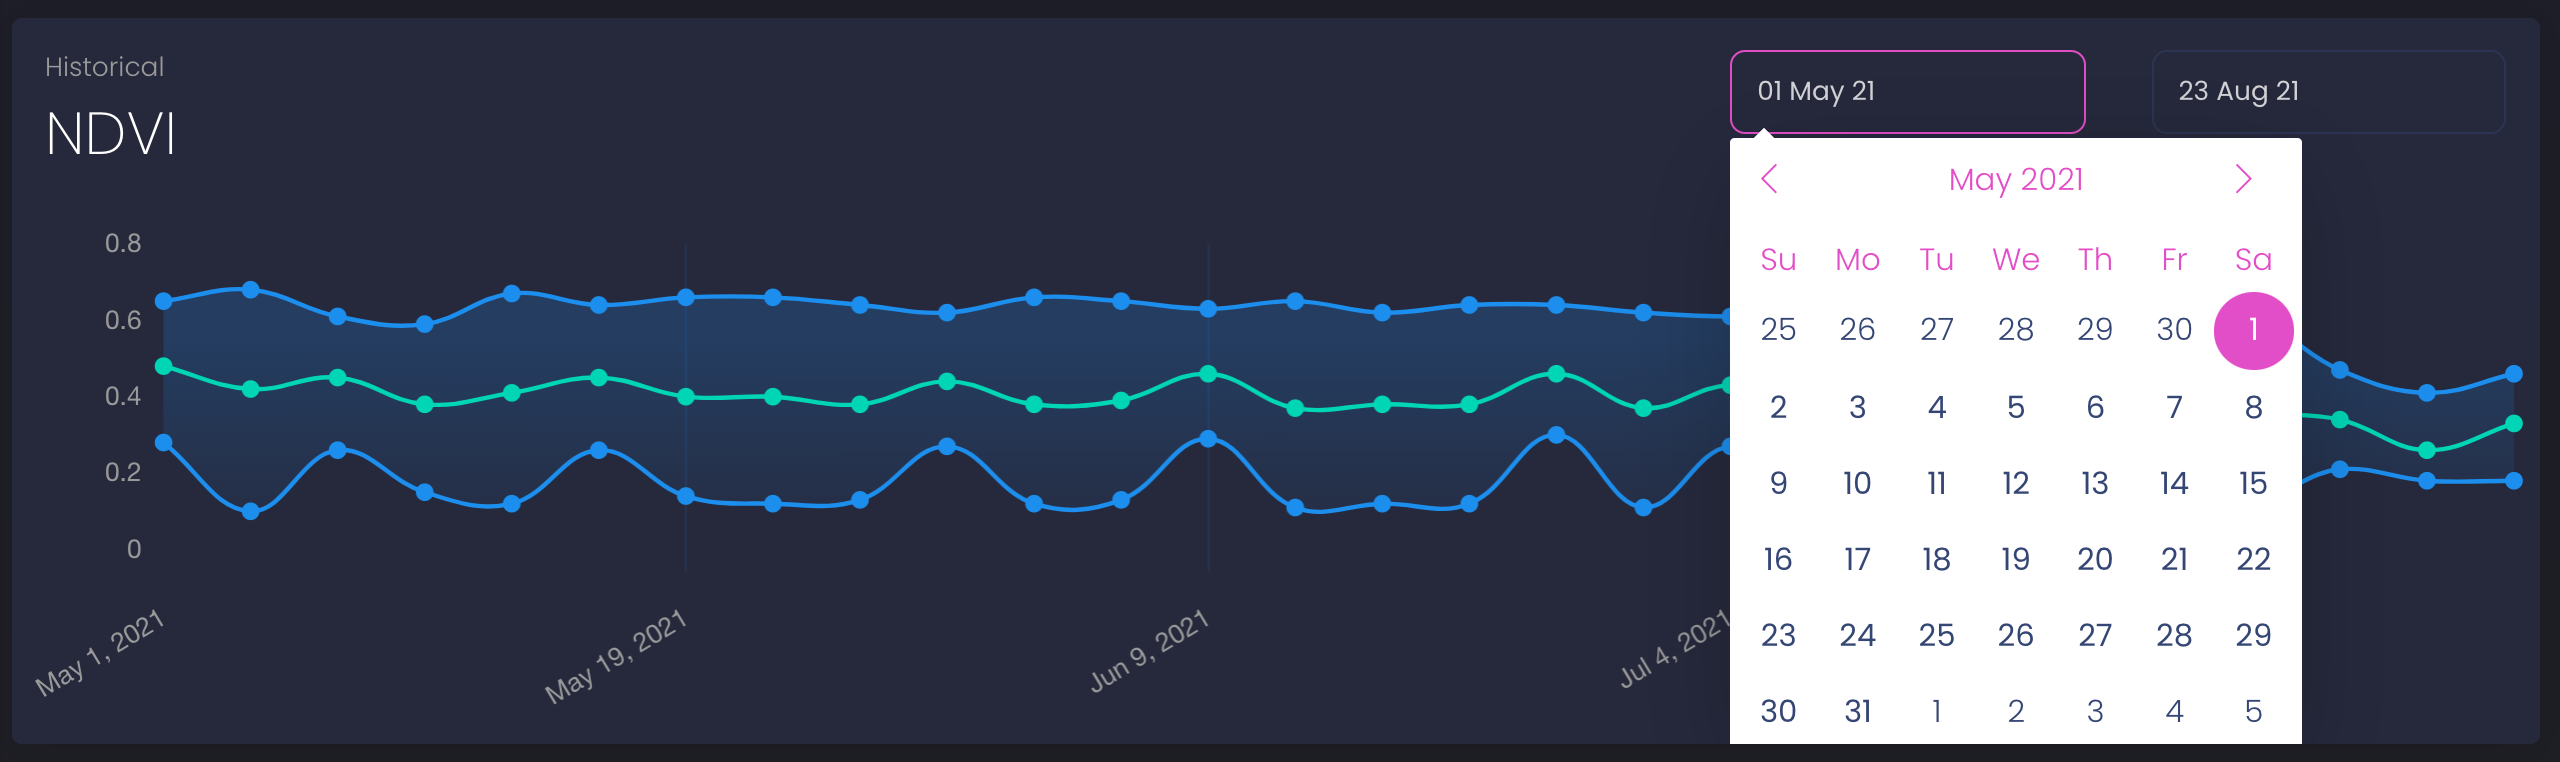
Legend
1. The Y-axis is the numerical value of NDVI.
2. The X-axis shows dates for which NDVI data is calculated.
-
These dates match the available satellite images on the date line below the map. If you click on any item from the list of satellite imagery, you get detailed statistics and see the image on the map.
If you have any questions or comments, please contact us at info@openweathermap.org.