
Agricultural Dashboard to monitor your fields
Agro Dashboard is a visual service that helps you to monitor your field states over the year. It covers nearly any territory where agricultural activities are possible. The service is based on the Agro APIs that operate with satellite imagery and weather data along with advanced machine learning technologies. You can get an access to the Agro Dashboard in all subscriptions, without a separate fee.
-
Advanced crop recognition based on machine learning technology will help you to operate with field contours easy and accurately
-
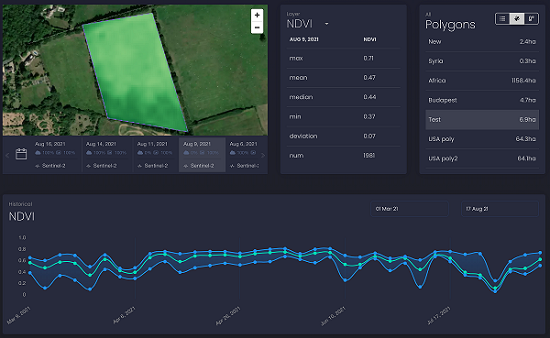
Wide range of vegetation indices such as NDVI, EVI, DSWI, NDWI, NRI, etc. lets you identify anomalies in your fields and plan further actions, and with a historical NDVI chart you can analyze the changes in the level of vegetation in your field through the seasons
-
Accurate and generous weather data for your fields includes current state of weather, soil, weather alerts; weather forecasts with hourly (2 days) and daily granulation (8 days); resent temperature, precipitation, soil temperature and moisture; accumulated temperature and precipitation
Dashboard documentation
Please visit our Documentation to start using the Dashboard.
About Dashboard
Dashboard is a practical tool for developers of agricultural applications that makes a visual representation of what we provide through our Agro APIs. Developers can use this tool to evaluate how APIs work, assess quantity and quality of data, and the whole effectiveness of the service.
You can also utilise Dashboard for monitoring of field state over the year. With a simple interface, you will be able to get practical agricultural data for the fields to monitor and analyse their conditions without any coding involved.